Executive Summary — Net Base Case
Net CAGR
23.65%
Full historical evaluation
Max Drawdown
-10.09%
Audited daily-engine result
Final Multiple
18.07×
$10,000 → $180,652
Base case period: 2013-01-02 – 2026-08-31 · Modeled commissions and implementation friction.
Return & risk
CAGR 23.65% · MDD -10.09% · Volatility 12.83%
Recovery & robustness
Maximum recovery 206 sessions · Robustness score 70.41
Data & Methodology
| Item | Public methodology |
|---|
| Evaluation period | 2 January 2013 – 31 August 2026. |
| Frequency | Daily historical simulation using finalized market data. |
| Portfolio form | Fully funded, long-only multi-asset allocation; no leverage and no short selling. |
| Execution convention | Consistent historical implementation after finalized market data; exact live operating rules remain private. |
| Net base case | Disciplined implementation with modeled transaction friction and dividend-adjusted series where applicable. |
| Benchmark | Broad U.S. Equity Benchmark shown consistently across the Tactical materials; distributions assumed reinvested. |
| Activity profile | Portfolio updates occur only when the proprietary process identifies a meaningful change; exact event logic is private. |
| Disclosure boundary | Performance, risk evidence and implementation assumptions are public; production portfolio-construction and decision logic remain private. |
All headline figures and charts refer to the same audited public investor version and the same benchmark definition.
Equity Curve — Linear Scale
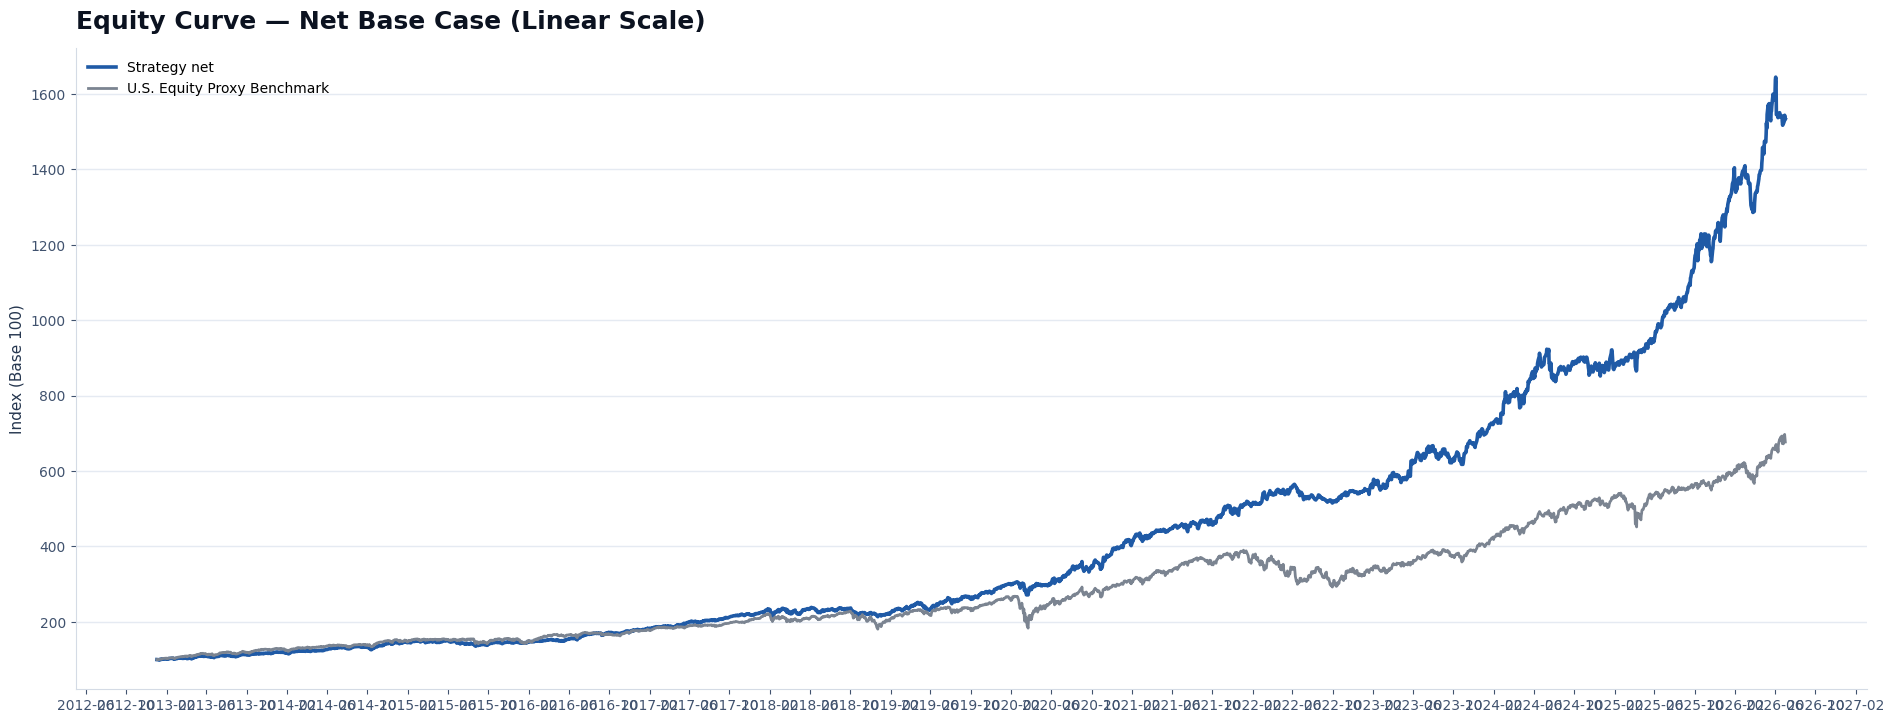
Net strategy simulation and the same public U.S. equity reference used throughout the site.
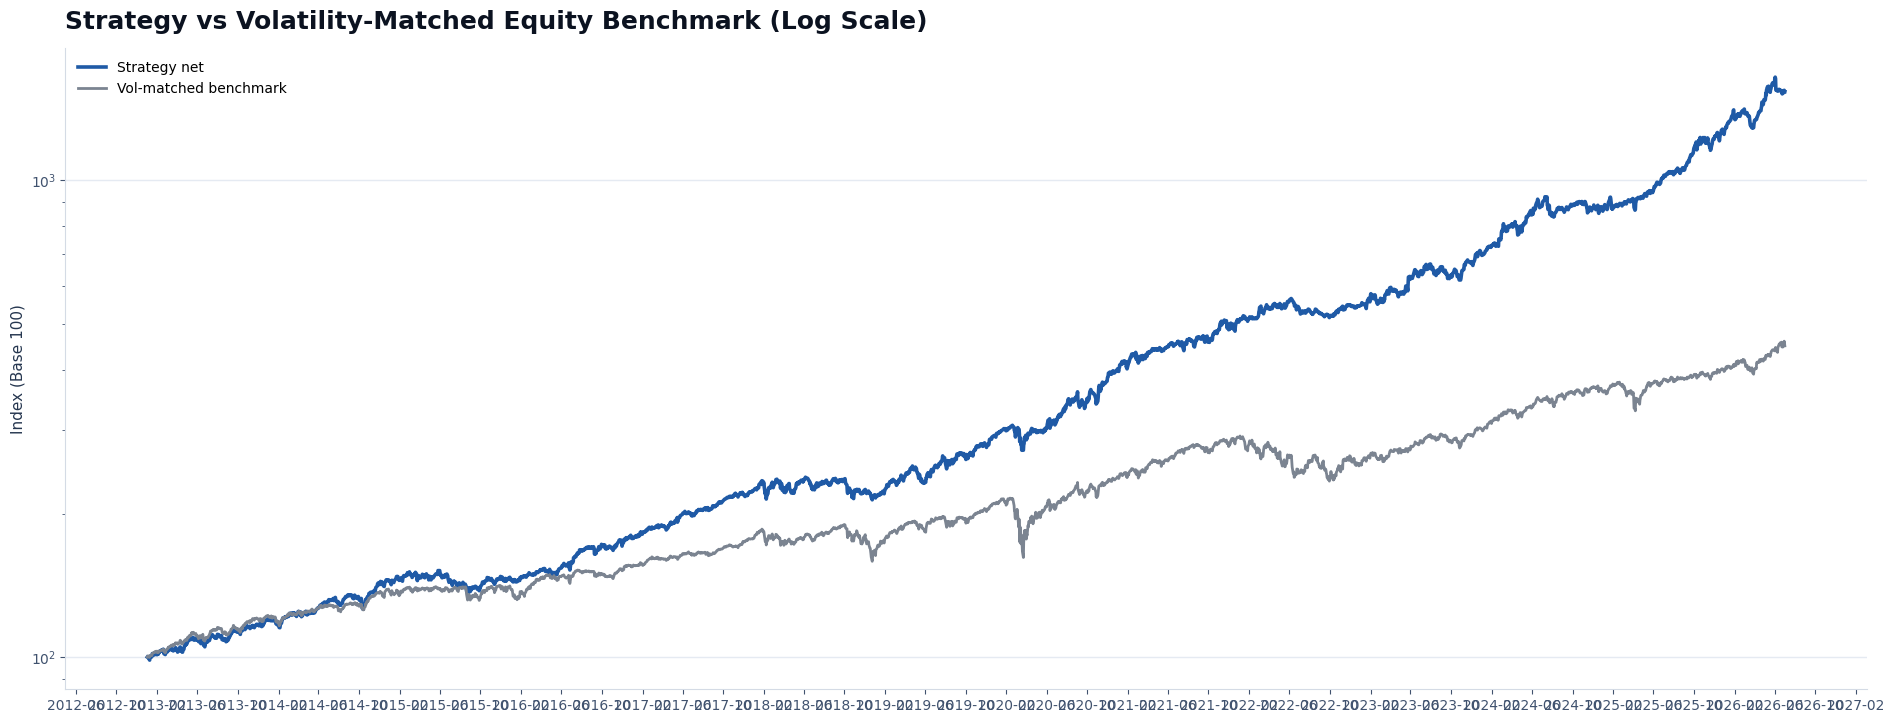
Equity Curve — Log Scale
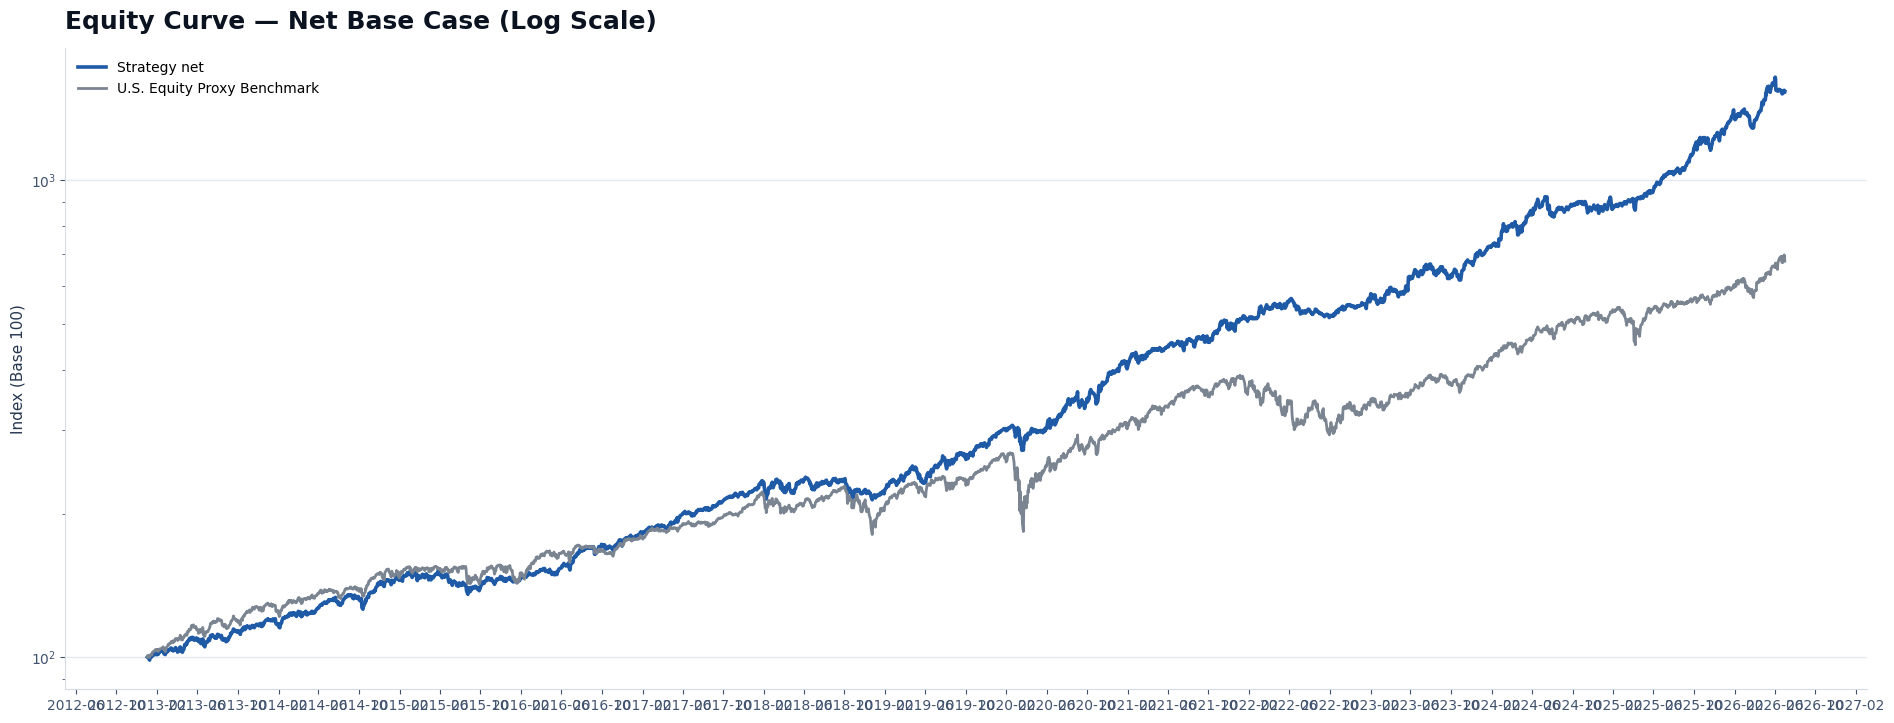
Log scale makes long-horizon compounding and drawdown episodes easier to compare.
Portfolio Construction — Public Disclosure Boundary
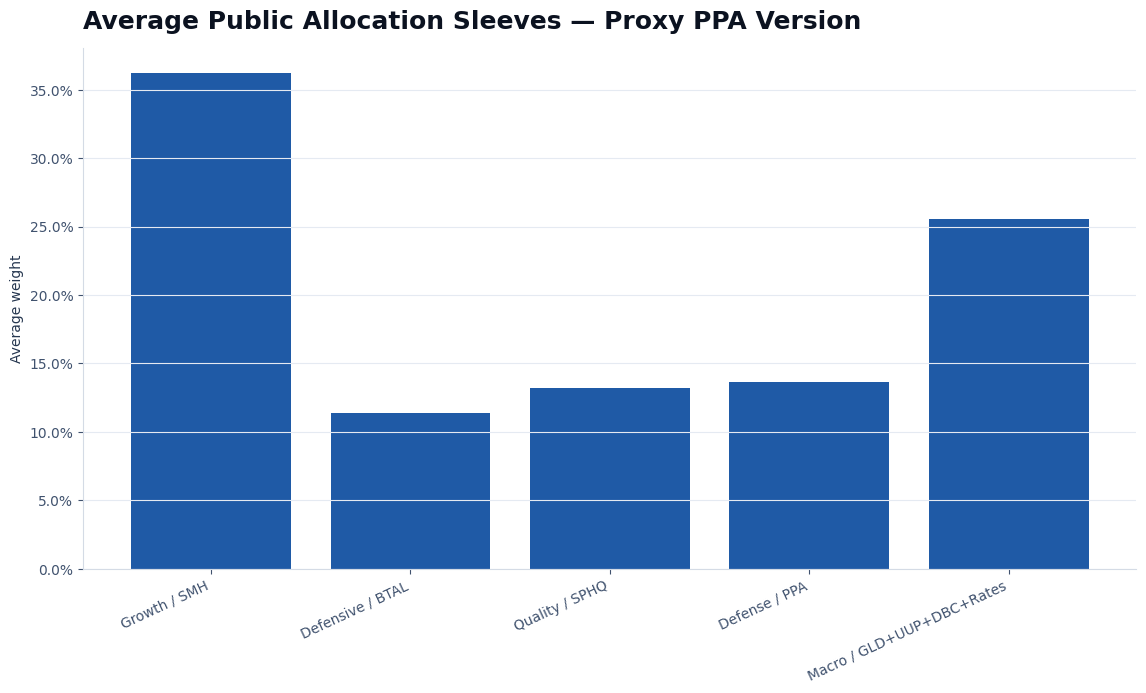
Investor-facing overview only. Production portfolio-construction and decision logic are intentionally omitted.
Key Metrics (Strategy vs U.S. Equity Benchmark)
| Metric | Strategy | U.S. Equity Benchmark | Interpretation |
|---|
| CAGR | 23.65% | 14.83% | Annualized compounded growth. |
| Maximum drawdown | -10.09% | -33.72% | Worst historical peak-to-trough decline. |
| Annualized volatility | 12.83% | 16.77% | Annualized variability of daily returns. |
| Return / volatility | 1.84 | 0.88 | Risk-adjusted return diagnostic. |
| Calmar | 2.34 | 0.44 | CAGR divided by absolute maximum drawdown. |
| Ulcer index | 2.88% | 6.33% | Depth and persistence of drawdowns. |
| Maximum recovery days | 206 | 488 | Longest audited time below the prior high-water mark. |
| Final multiple | 18.07× | 6.61× | Growth of one unit of starting capital. |
Daily Tail Risk: VaR & Expected Shortfall
| One-day diagnostic | Strategy | U.S. Equity Benchmark |
|---|
| VaR 95% | -1.23% | -1.59% |
| Expected shortfall / CVaR 95% | -1.88% | -2.54% |
| Annualized volatility | 12.83% | 16.77% |
Interpretation: VaR is a threshold diagnostic, not a maximum-loss estimate. Losses can exceed it because of gaps, liquidity stress, instrument events, execution failures, model error or a future regime absent from the historical sample.
Historical Drawdown & Recovery
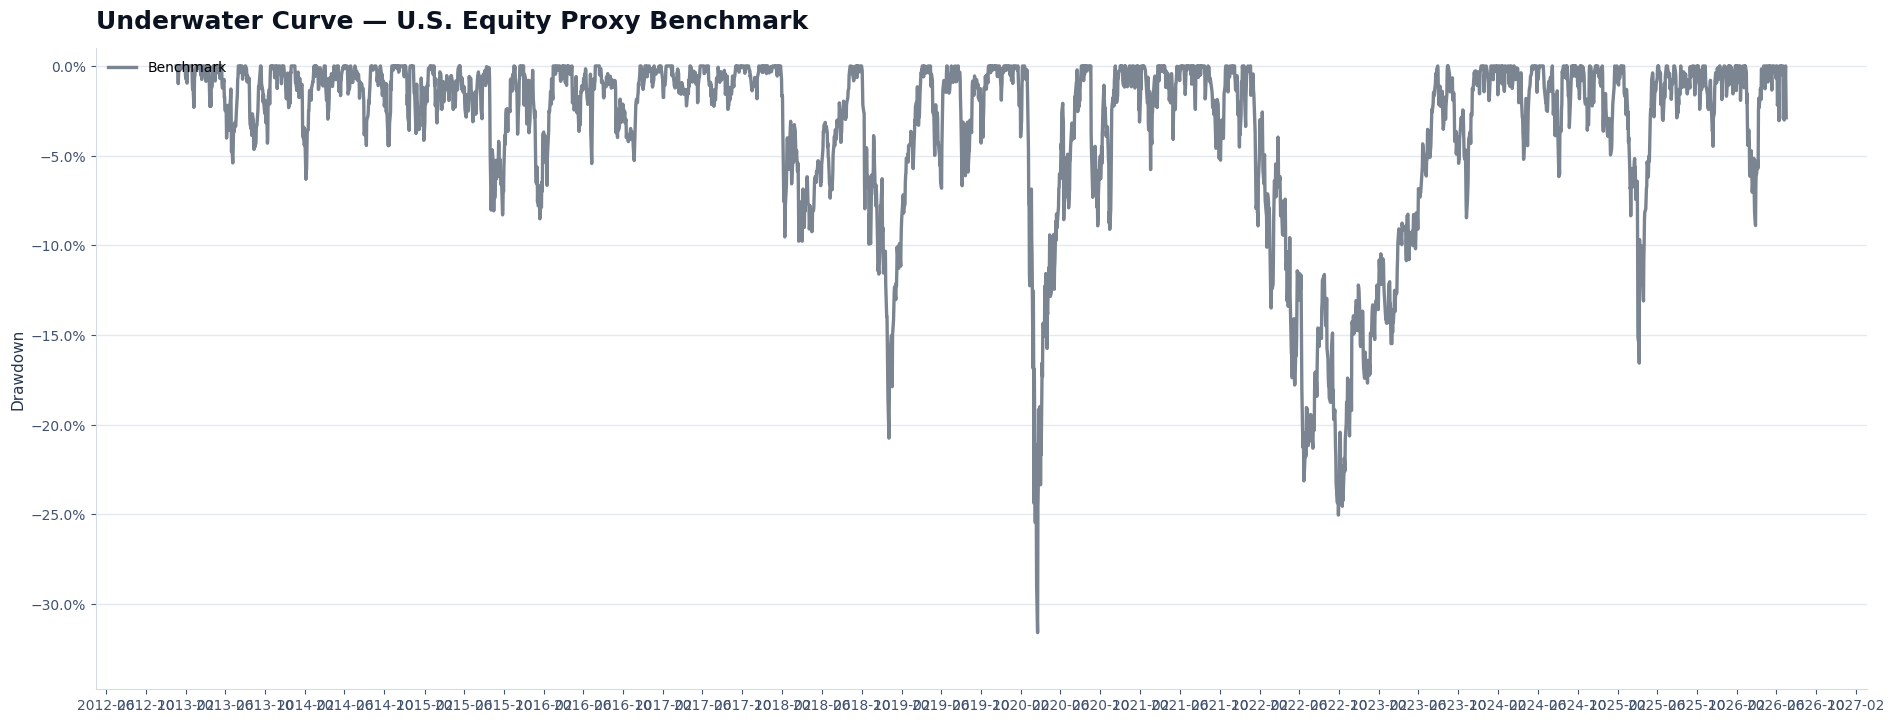
| Diagnostic | Strategy | Benchmark |
|---|
| Historical maximum drawdown | -10.09% | -33.72% |
| Maximum recovery interval | 206 sessions | 488 sessions |
| Ulcer index | 2.88% | 6.33% |
The observed maximum drawdown is not a future loss limit; the Monte Carlo section provides a wider tail range for planning.
Rolling Stability — Returns
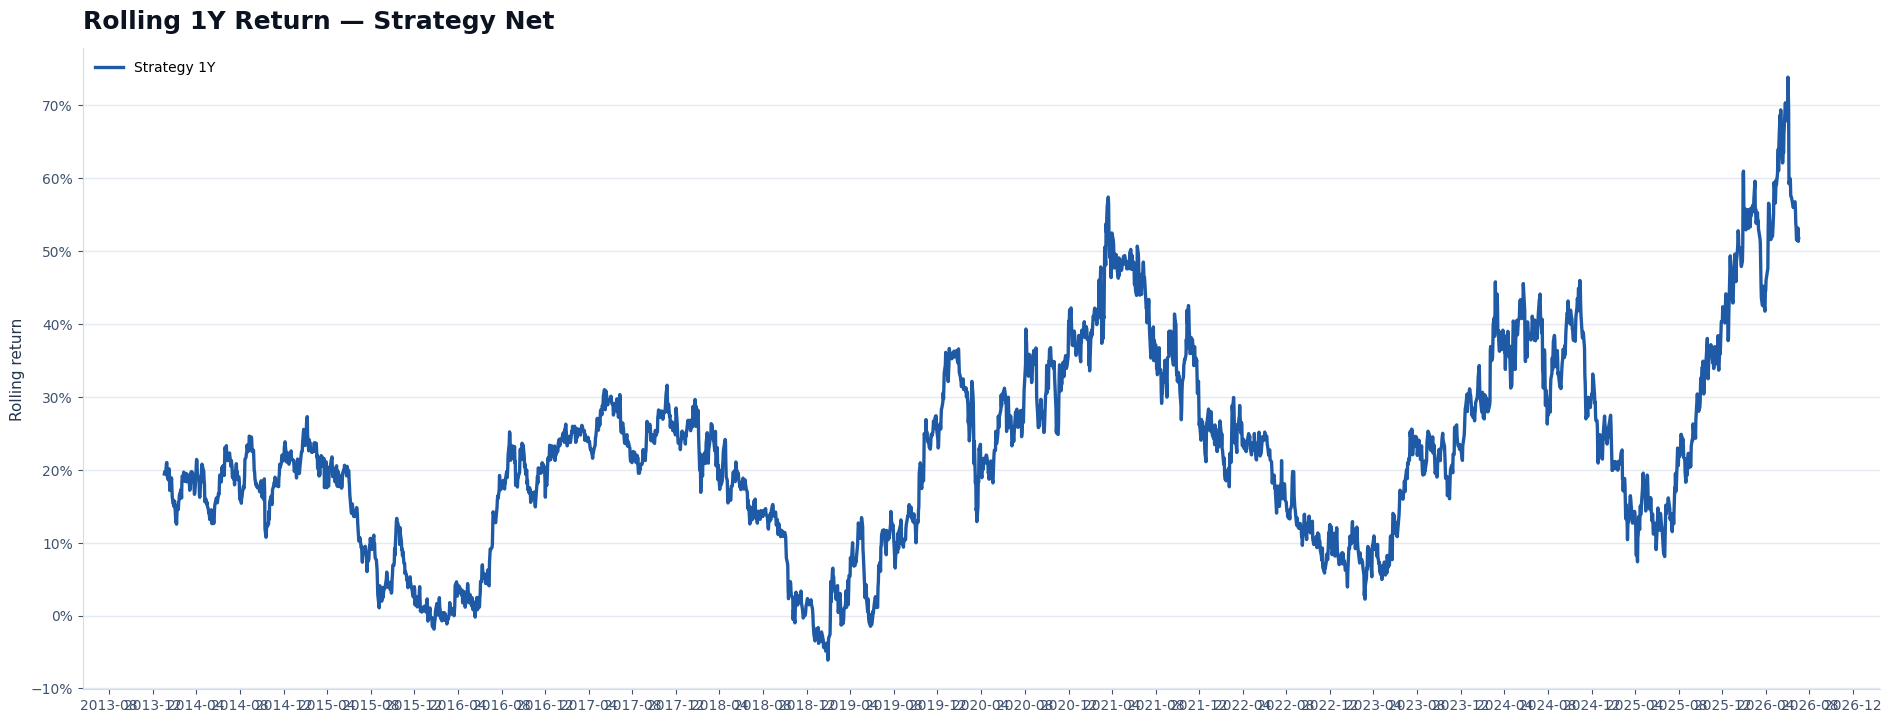
Every available one-year start window, rather than only the full-period result.
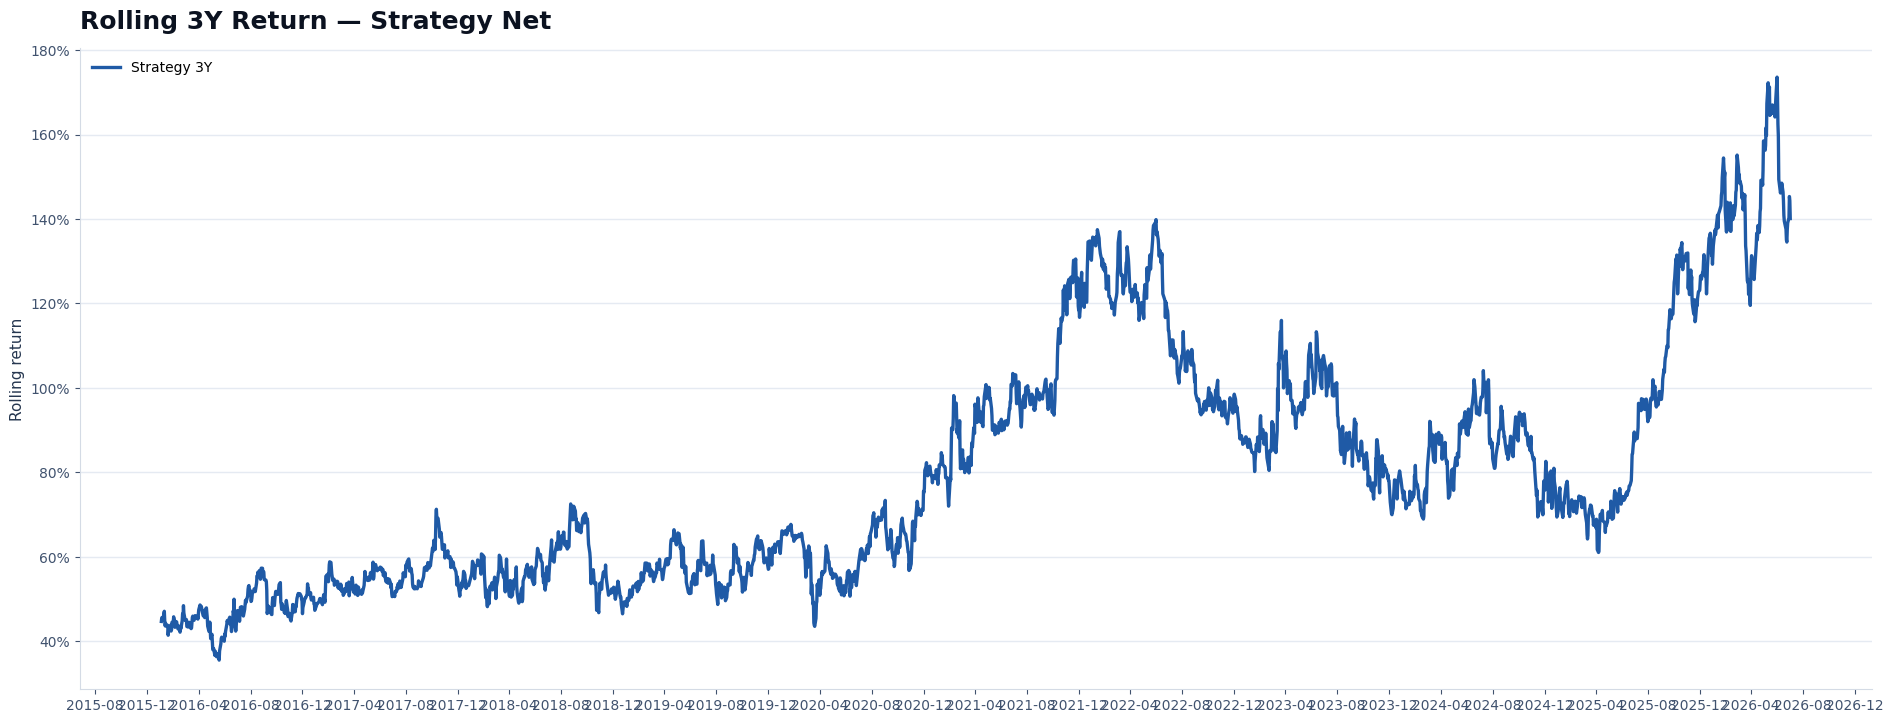
Longer windows test whether compounding depends on a narrow entry date.
Rolling Stability — Risk
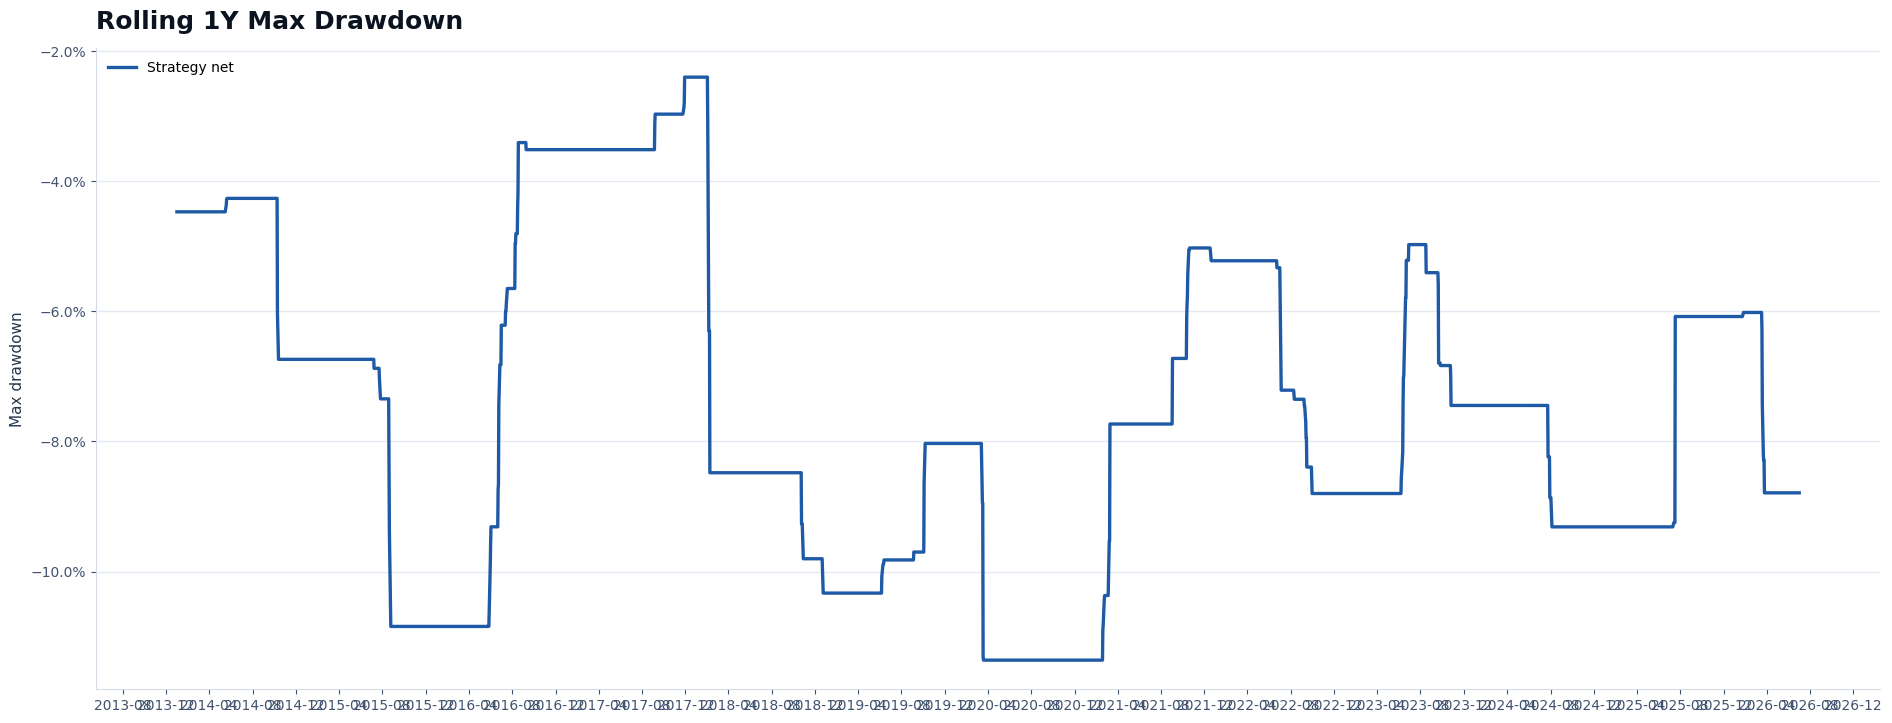
One-year drawdown severity through changing market environments.
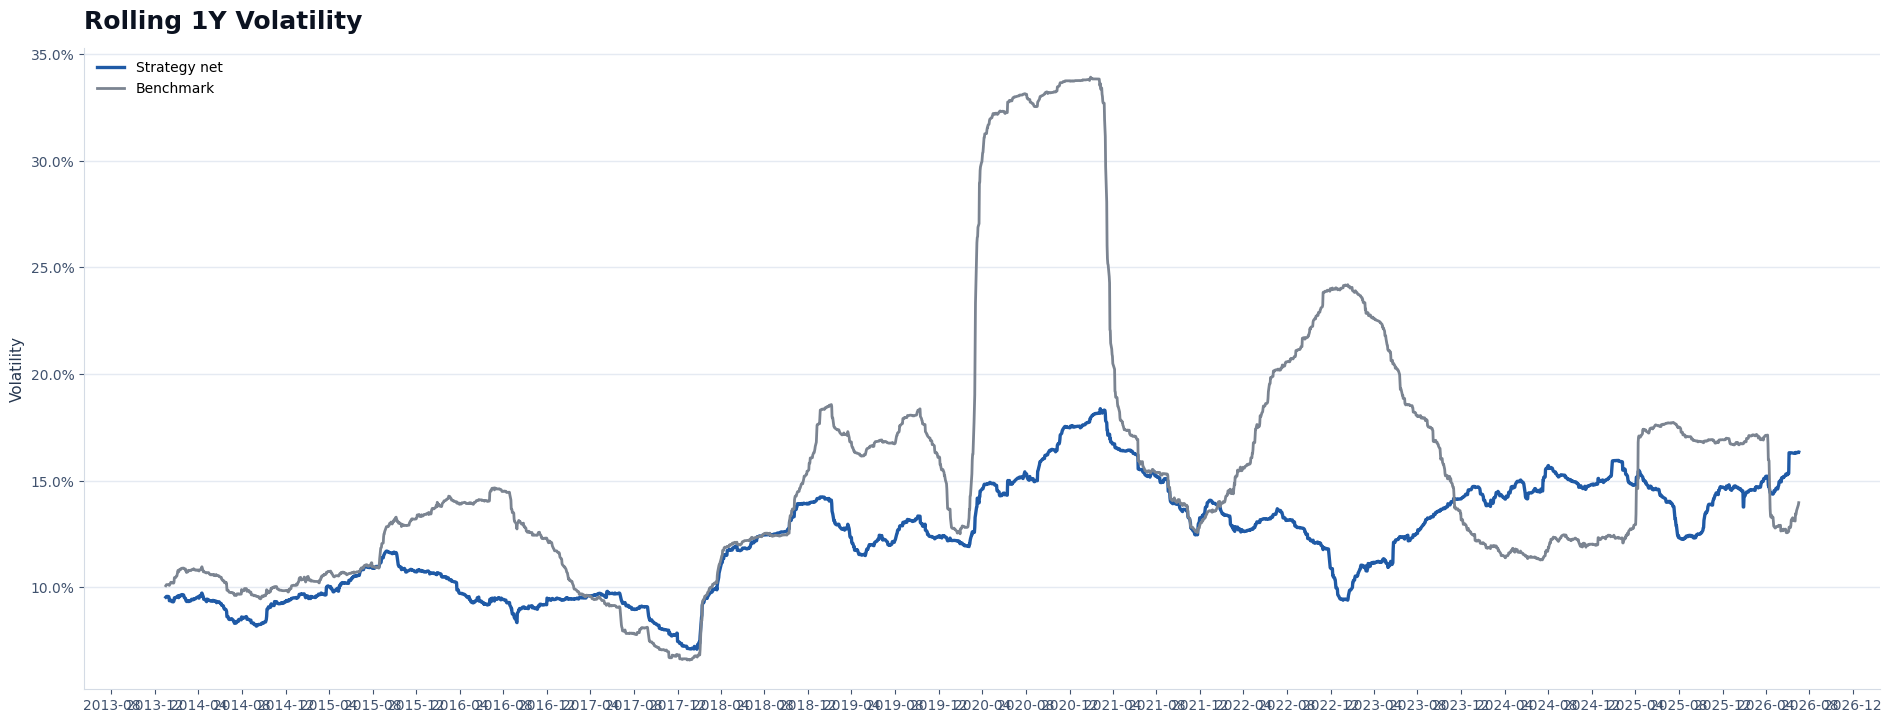
Variation in realized risk through time.
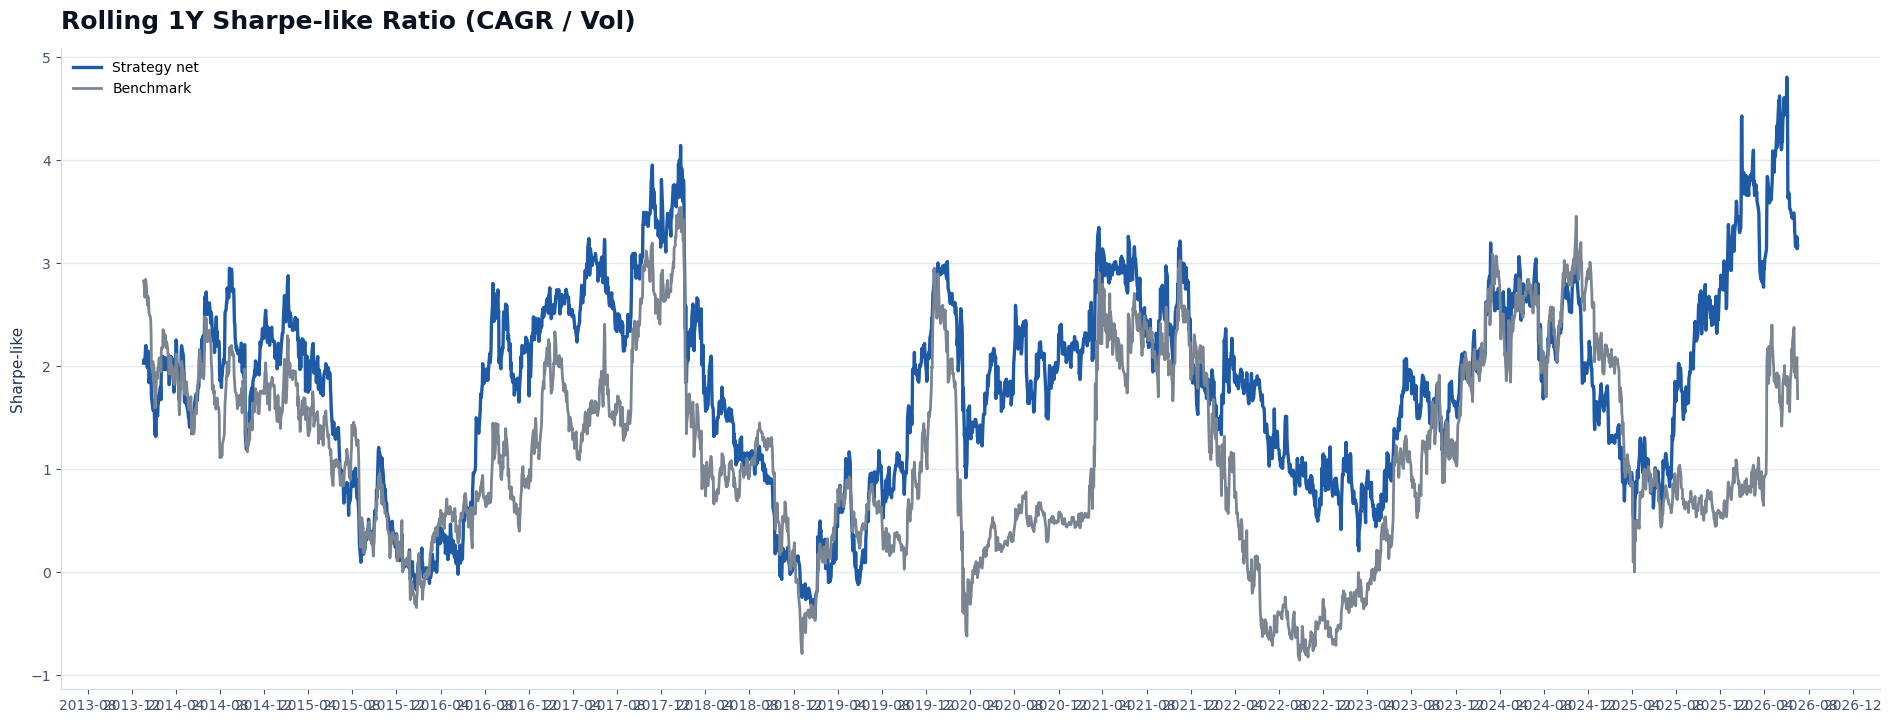
Rolling risk-adjusted comparison with the public benchmark.
Validation Scope & Public Evidence
| Study | Coverage in this factsheet | Purpose |
|---|
| Rolling return and risk windows | 1Y and 3Y returns; 1Y volatility, drawdown and risk-adjusted return | Detect start-date concentration and regime dependence. |
| Execution-delay sensitivity | Multiple anonymized timing scenarios | Test operational timing risk. |
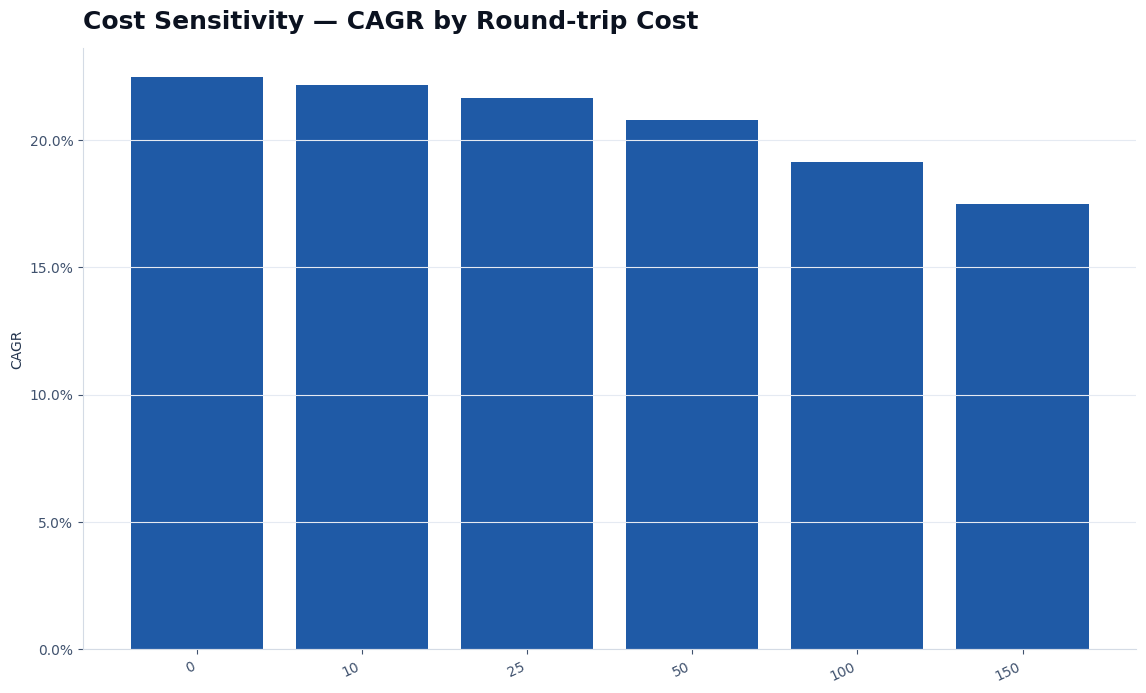
| Modeled-friction sensitivity | Multiple modeled friction levels | Measure degradation under higher costs. |
| Historical stress review | 2018 risk-off, 2020 shock, 2022 tightening and later environments | Compare behavior in known adverse periods. |
| Moving-block bootstrap | 1,000 paths, 21-session blocks | Estimate return and drawdown dispersion while preserving short-run dependence. |
| Separate public time holdout | Not supplied as a distinct dataset in the audited public package | No out-of-sample claim is made where separate evidence is unavailable. |
| Additional internal perturbation files | Not supplied in this package | The factsheet does not fabricate sensitivity or layer-removal results. |
This inventory distinguishes validated public evidence from studies that would require additional source data.
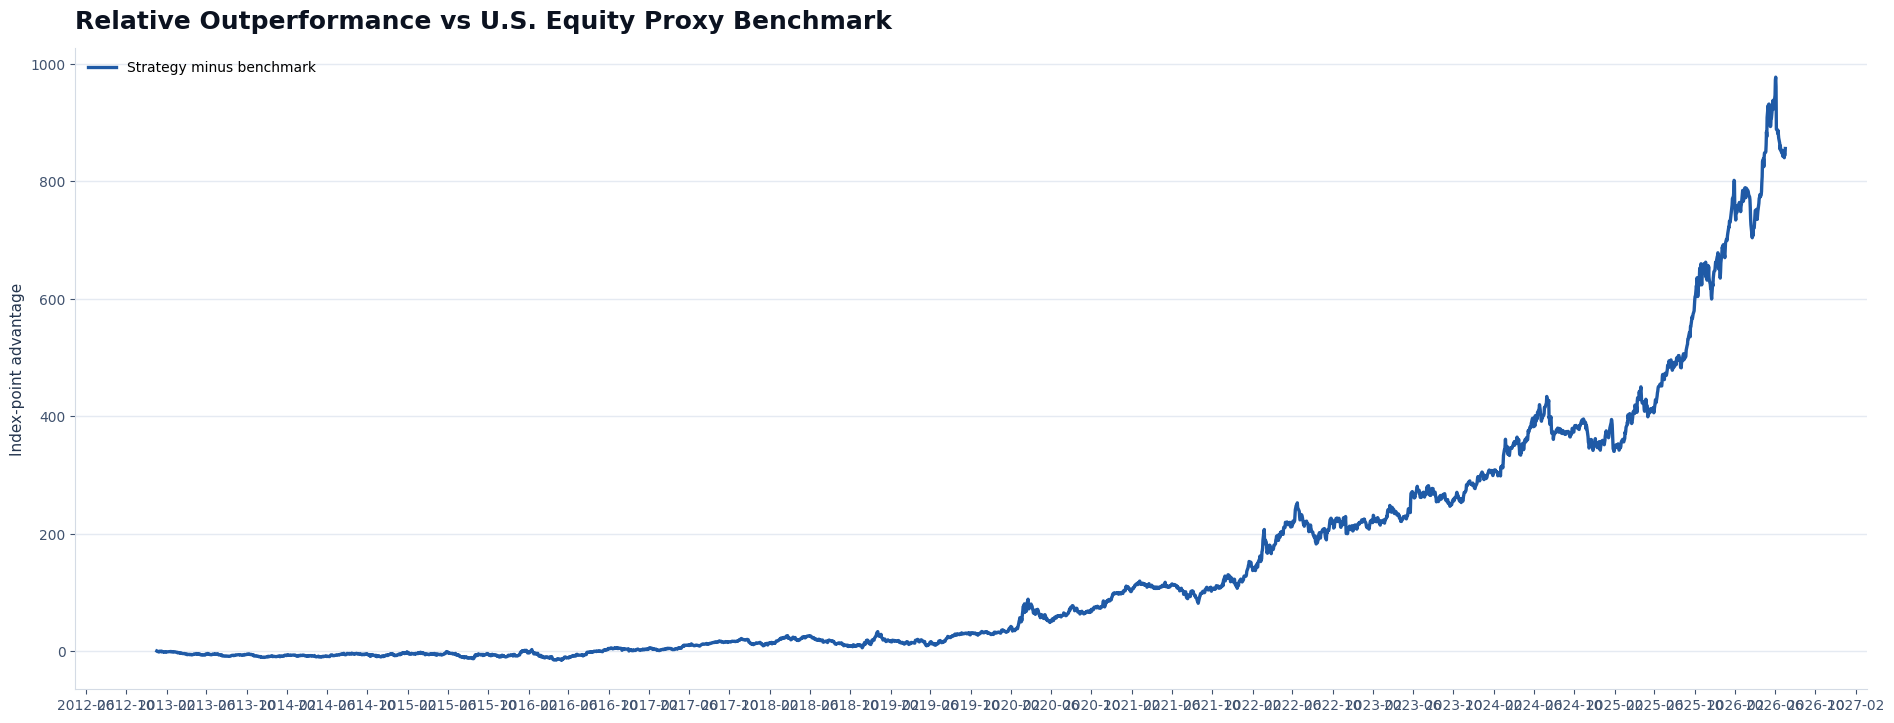
Relative and Volatility-Matched Comparisons
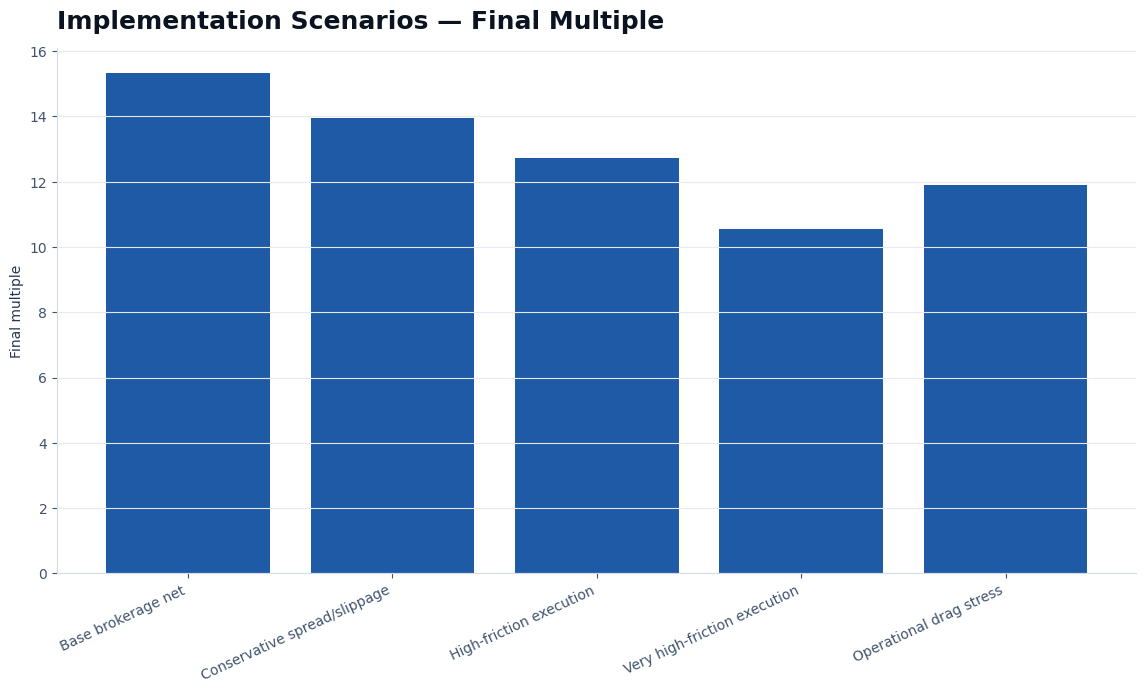
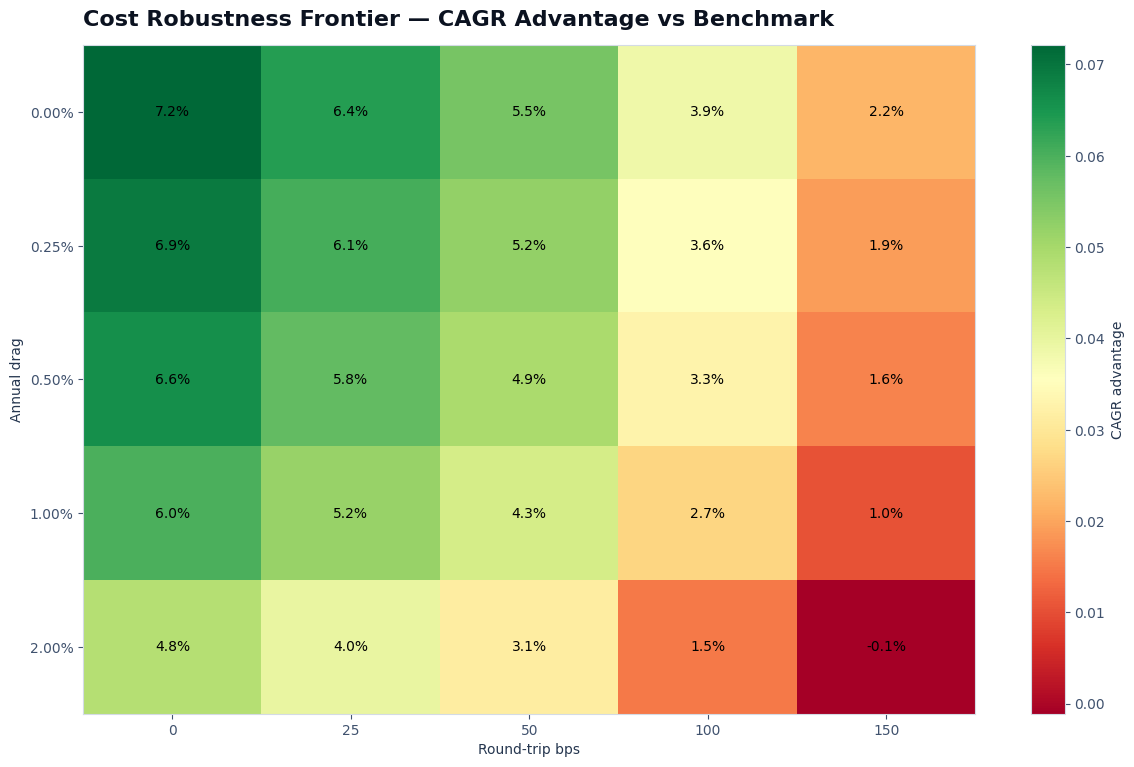
Costs and Implementation Sensitivity
| Scenario | CAGR | MDD | Calmar |
|---|
| Scenario A | 23.45% | -10.12% | 2.32 |
| Base implementation | 23.65% | -10.09% | 2.34 |
| Scenario C | 23.34% | -10.67% | 2.19 |
| Scenario B | 23.54% | -10.63% | 2.21 |
| Scenario E | 22.53% | -10.76% | 2.09 |
| Scenario D | 22.73% | -10.73% | 2.12 |
The production framework was rerun under each anonymized implementation scenario; figures are not simple arithmetic haircuts.
Execution & Structural Robustness
| Implementation case | CAGR | MDD | Calmar | Change vs base CAGR |
|---|
| Base implementation | 23.65% | -10.09% | 2.34 | — |
| Scenario B | 23.54% | -10.63% | 2.21 | -0.11 pp |
| Scenario D | 22.73% | -10.73% | 2.12 | -0.92 pp |
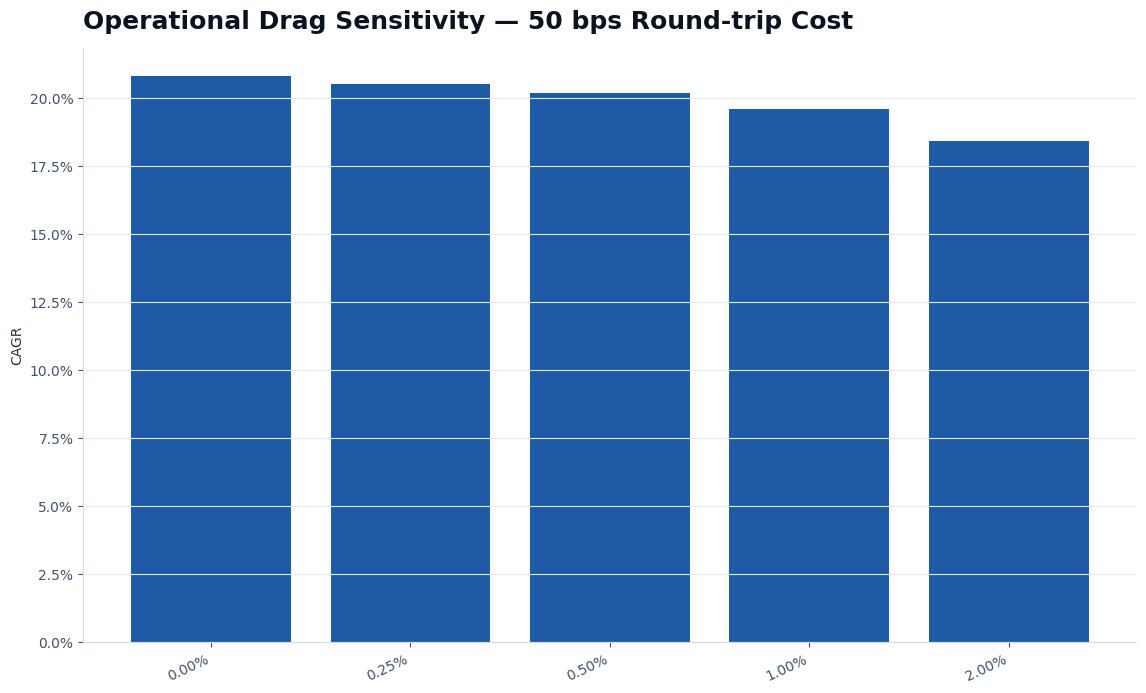
| Severe friction scenario | 19.84% | -10.70% | 1.86 | -3.81 pp |
Operational conclusion: the historical edge degrades gradually rather than disappearing under the tested implementation stresses. These tests do not cover every possible outage, stale signal, rejected order, tax effect or unavailable instrument.
Cost Robustness and Annual Drag
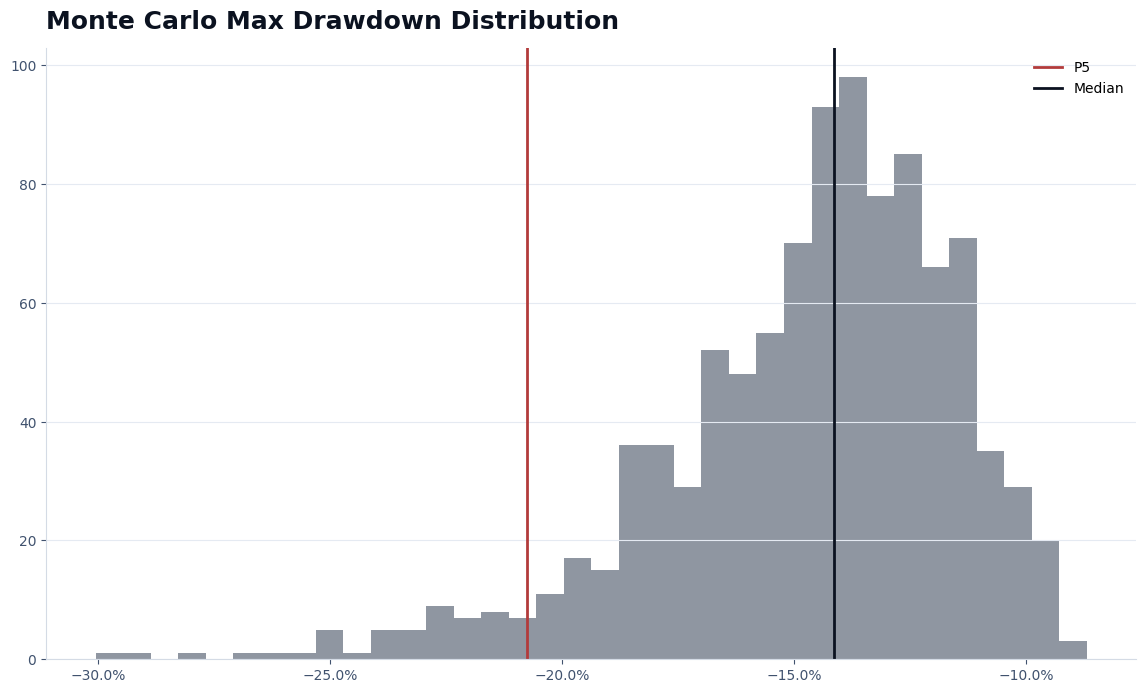
Probability of Severe Impairment & Recovery
| Diagnostic | Result | Interpretation |
|---|
| Historical maximum drawdown | -10.09% | Worst observed full-history decline. |
| Maximum historical recovery | 206 sessions | Longest audited interval below a prior high. |
| Monte Carlo median maximum drawdown | -13.73% | Typical simulated maximum decline across the bootstrap paths. |
| Monte Carlo adverse-tail MDD (5th percentile) | -19.66% | Planning evidence materially worse than the historical MDD. |
| P(MDD worse than −20%) | 4.60% | Frequency across 1,000 block-bootstrap paths. |
| P(positive CAGR) | 100.00% | Simulation result, not a guarantee of a positive live outcome. |
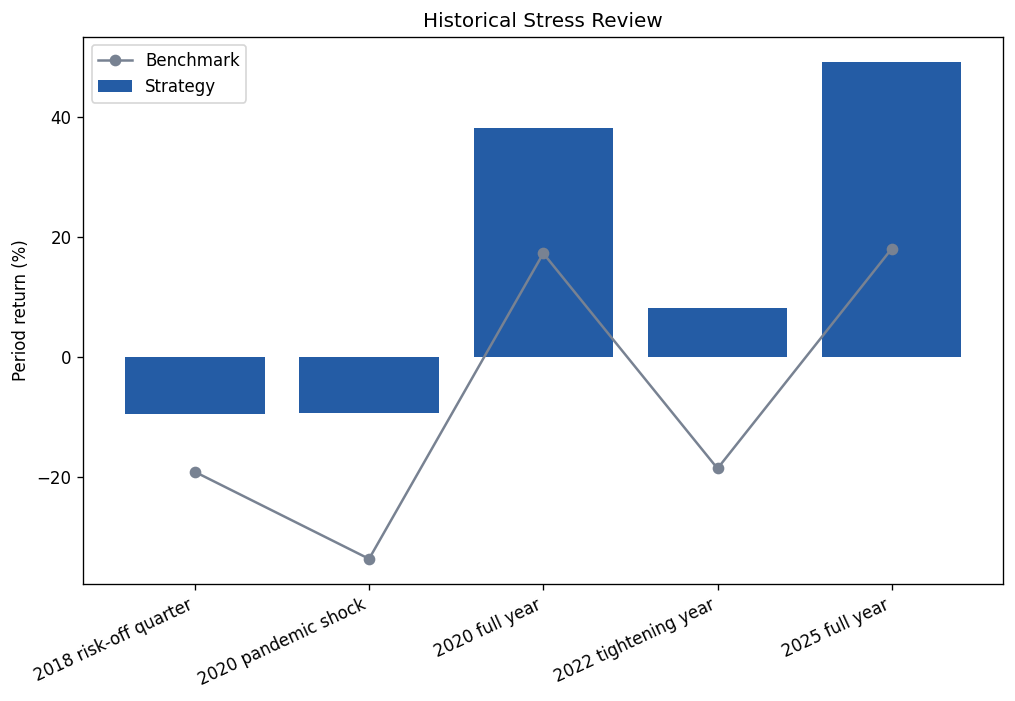
Historical Stress Review
| Historical period | Strategy return | Benchmark return | Strategy MDD | Benchmark MDD |
|---|
| 2018 risk-off quarter | -9.59% | -19.20% | -9.66% | -19.20% |
| 2020 pandemic shock | -9.36% | -33.72% | -10.08% | -33.72% |
| 2020 full year | 38.05% | 17.24% | -10.08% | -33.72% |
| 2022 tightening year | 8.07% | -18.65% | -9.35% | -24.50% |
| 2025 full year | 49.20% | 18.01% | -6.16% | -18.76% |
Historical Environment & Calendar-Year Review
| Calendar diagnostic | Result |
|---|
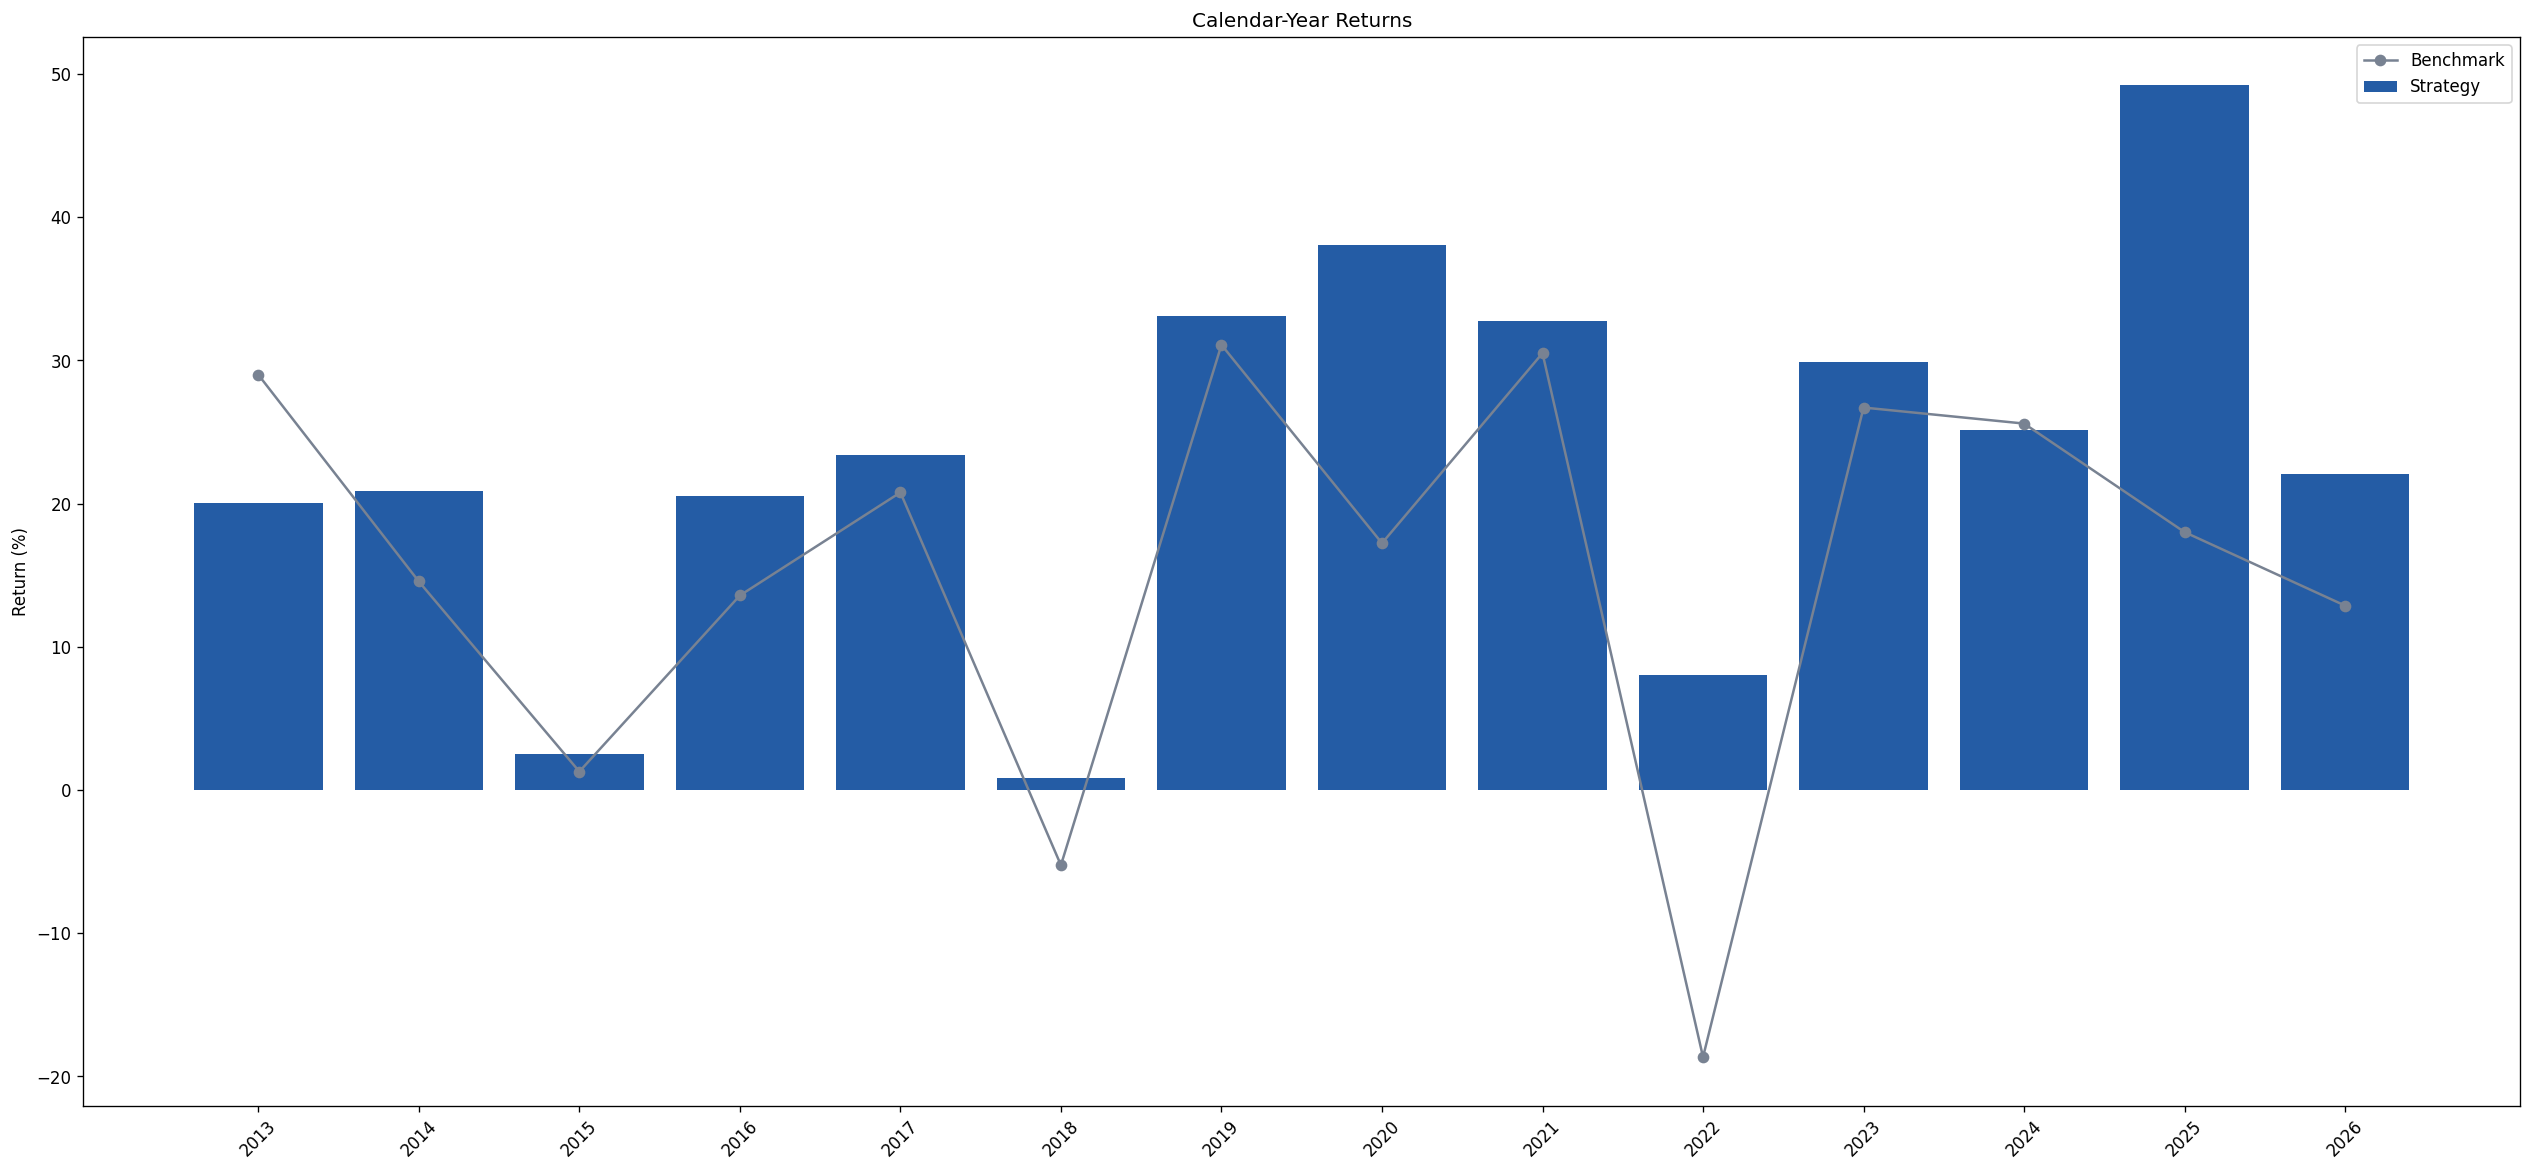
| Completed years evaluated | 13 (2013–2025) |
| Positive strategy years | 13 of 13 |
| Years above the benchmark | 11 of 13 |
| Median calendar-year return | 23.38% |
| Weakest completed year | 2018: 0.85% vs benchmark -5.25% |
| Strongest completed year | 2025: 49.20% vs benchmark 18.01% |
| 2026 year-to-date | 22.08% vs benchmark 12.87%, through 31 August 2026 |
Calendar-year results describe realized historical environments; they are not independent trials and do not replace rolling-window analysis.
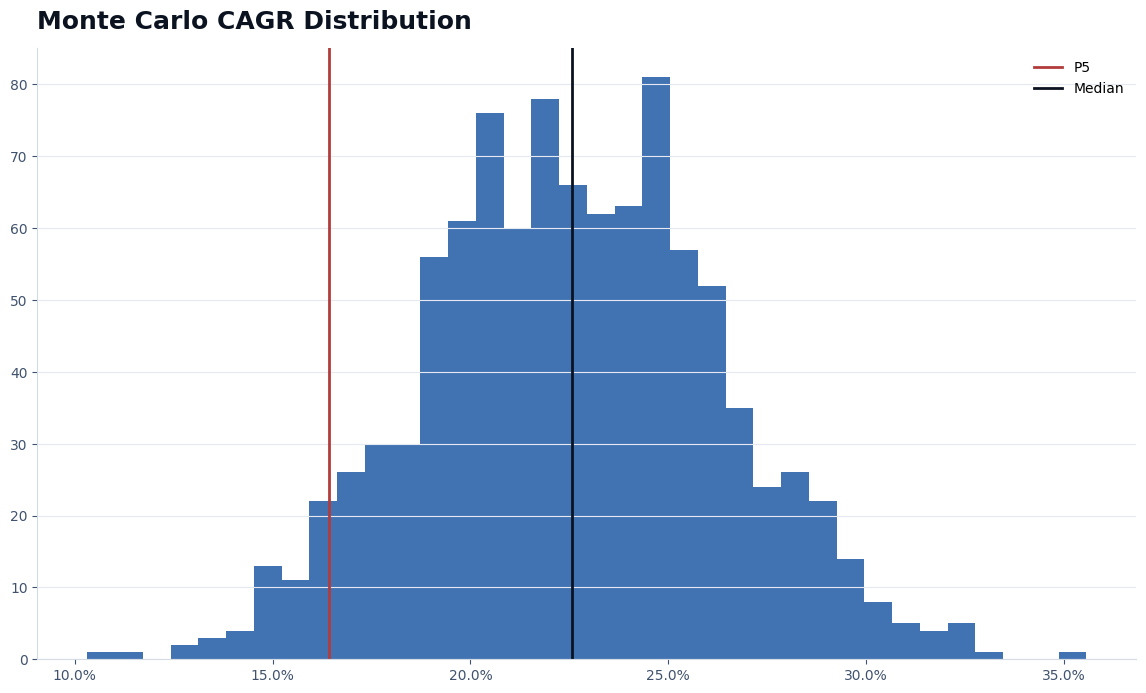
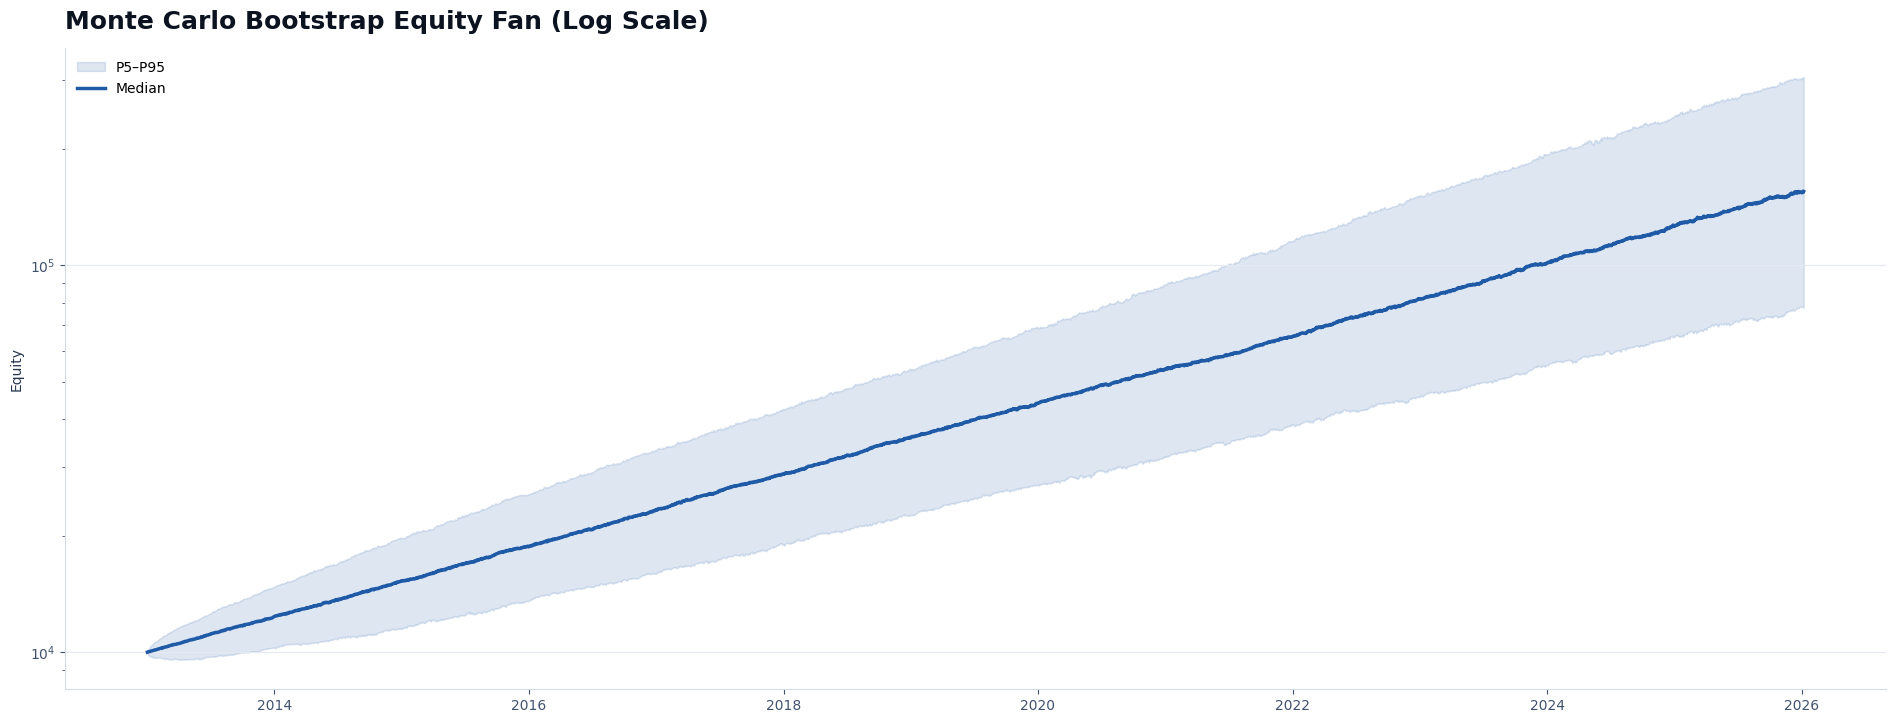
Monte Carlo Block Bootstrap
| Diagnostic | Result |
|---|
| Paths / block length | 1,000 / 21 sessions |
| CAGR 5th percentile | 17.83% |
| Median CAGR | 23.59% |
| CAGR 95th percentile | 29.45% |
| Adverse-tail maximum drawdown (5th percentile) | -19.66% |
| Median maximum drawdown | -13.73% |
| Probability CAGR > 10% | 100.00% |
| Probability MDD worse than −20% | 4.60% |
Moving-block resampling preserves short-run dependence better than independent daily shuffling, but cannot model every future structural break, instrument failure or execution disruption.
Methodology & Governance
Research discipline- Maintain a frozen public reference version.
- Apply the same data, benchmark and implementation convention across all reported studies.
- Judge changes on risk, rolling stability, execution realism and commercial logic—not headline CAGR alone.
- Avoid automatic parameter changes merely because recent performance differs from history.
Disclosure discipline- Publish performance, costs, risks and validation results without exposing portfolio construction logic.
- Keep exact instruments, operating weights and proprietary thresholds private.
- Label historical simulation, synthetic stress and bootstrap evidence separately.
- Do not describe unavailable public evidence as out-of-sample or parameter validation.
Investor Fit
Potentially suitable for:- Long-horizon investors seeking systematic diversified exposure.
- Investors who value systematic risk management and diversification.
- Investors able to follow manual target-allocation alerts consistently.
- Fully funded brokerage accounts without leverage or short selling.
Not designed for:- Guaranteed capital or guaranteed returns.
- Investors unable to tolerate losses and recovery periods.
- Very short holding horizons or discretionary overrides.
- Public disclosure of proprietary instruments, weights or thresholds.
Strategy Profile
| Dimension | Profile |
|---|
| Primary objective | Long-horizon capital growth through a proprietary adaptive allocation process. |
| Portfolio form | Fully funded, long-only, multi-instrument target allocation. |
| Leverage / short selling | Not required. |
| Signal timing | Private target updates are issued after the strategy completes its decision process. |
| Delivery | Private manual target-allocation alerts with implementation instructions. |
| Copy trading | Not offered; the multi-instrument target-allocation structure is handled manually. |
| Benchmark role | Contextual broad U.S. equity reference, not a tracking target. |
Capacity & Liquidity Considerations
The framework is designed around liquid exchange-traded instruments, but practical capacity depends on account size, broker access, spreads, lot sizes, market depth, distributions, taxes and local trading constraints. Larger accounts should evaluate market impact and execution windows rather than assuming the modeled friction remains constant.
Implementation requires access to all instruments in the private allocation universe and enough cash flexibility to reach the consolidated target without leverage. Dividend or distribution reinvestment should be enabled where available to remain aligned with the total-return assumptions.
Review & Optimization Protocol
| Cadence | Required review |
|---|
| Monthly / quarterly monitoring | Data quality, signal delivery, tracking error, realized costs, instrument availability, rolling returns, rolling drawdown and recovery behavior. |
| Formal research review | Reproduce the frozen baseline; rerun rolling windows, timing and fee sensitivity, historical stress and block-bootstrap diagnostics. |
| Candidate-change gate | Require a coherent economic hypothesis, stable nearby behavior, no material risk deterioration and no dependence on a narrow historical episode. |
| Production change | Document, version and freeze the accepted configuration before publication or live use. |
Institutional Notes (Methodology & Interpretations)
Comparability: strategy and benchmark metrics use the same evaluation window and the same total-return benchmark treatment where applicable.
Historical versus simulated evidence: calendar returns and observed drawdowns describe the historical path; fee/delay scenarios and moving-block bootstrap results are model-based sensitivity diagnostics.
Model risk: a systematic process can fail because relationships change, instruments become unavailable, execution differs from assumptions or the future contains events absent from the sample.
Investor planning: capital should be sized to a drawdown budget materially wider than the observed -10.09% historical maximum.
Important Notes
Historical simulation: results are hypothetical and may differ from live outcomes because of taxes, spreads, commissions, rounding, cash flows, distributions and execution differences.
Risk: the observed maximum drawdown is not a future loss limit. Tail simulations indicate that materially larger drawdowns remain possible.
No forecast: past simulated performance does not guarantee future results.