
Azimuth Dynamic Strategy
Executive Summary (Net Base Case)
Benchmark Context
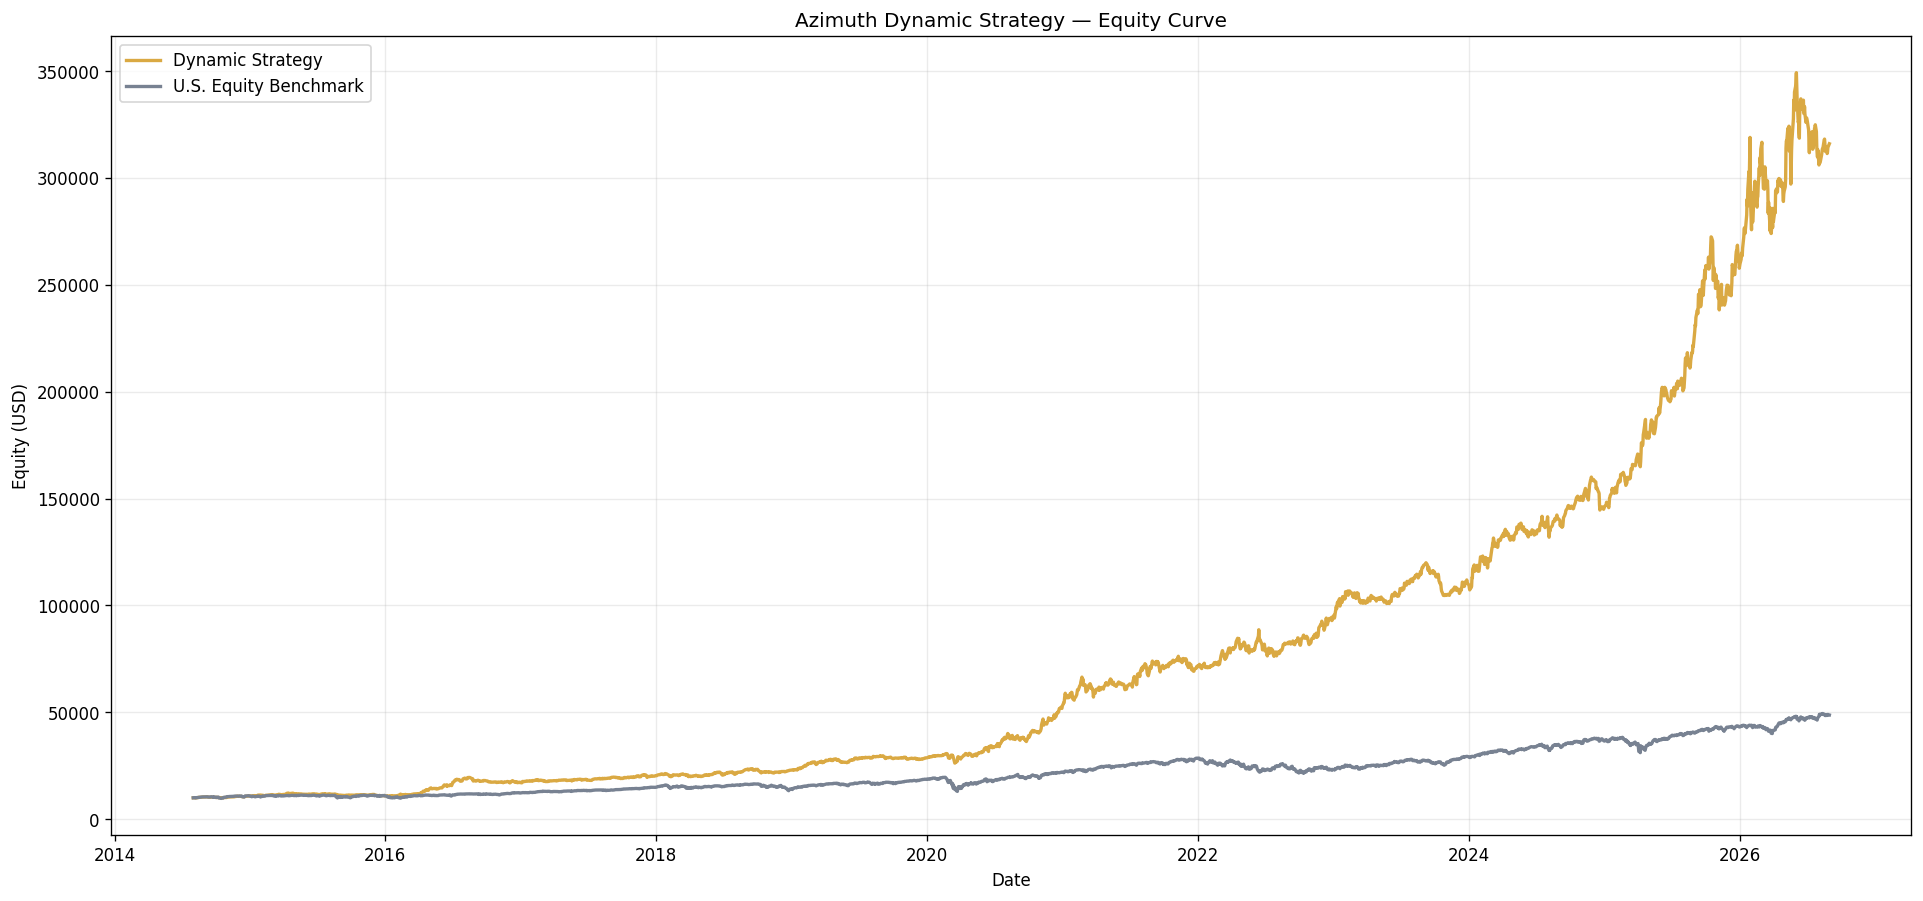
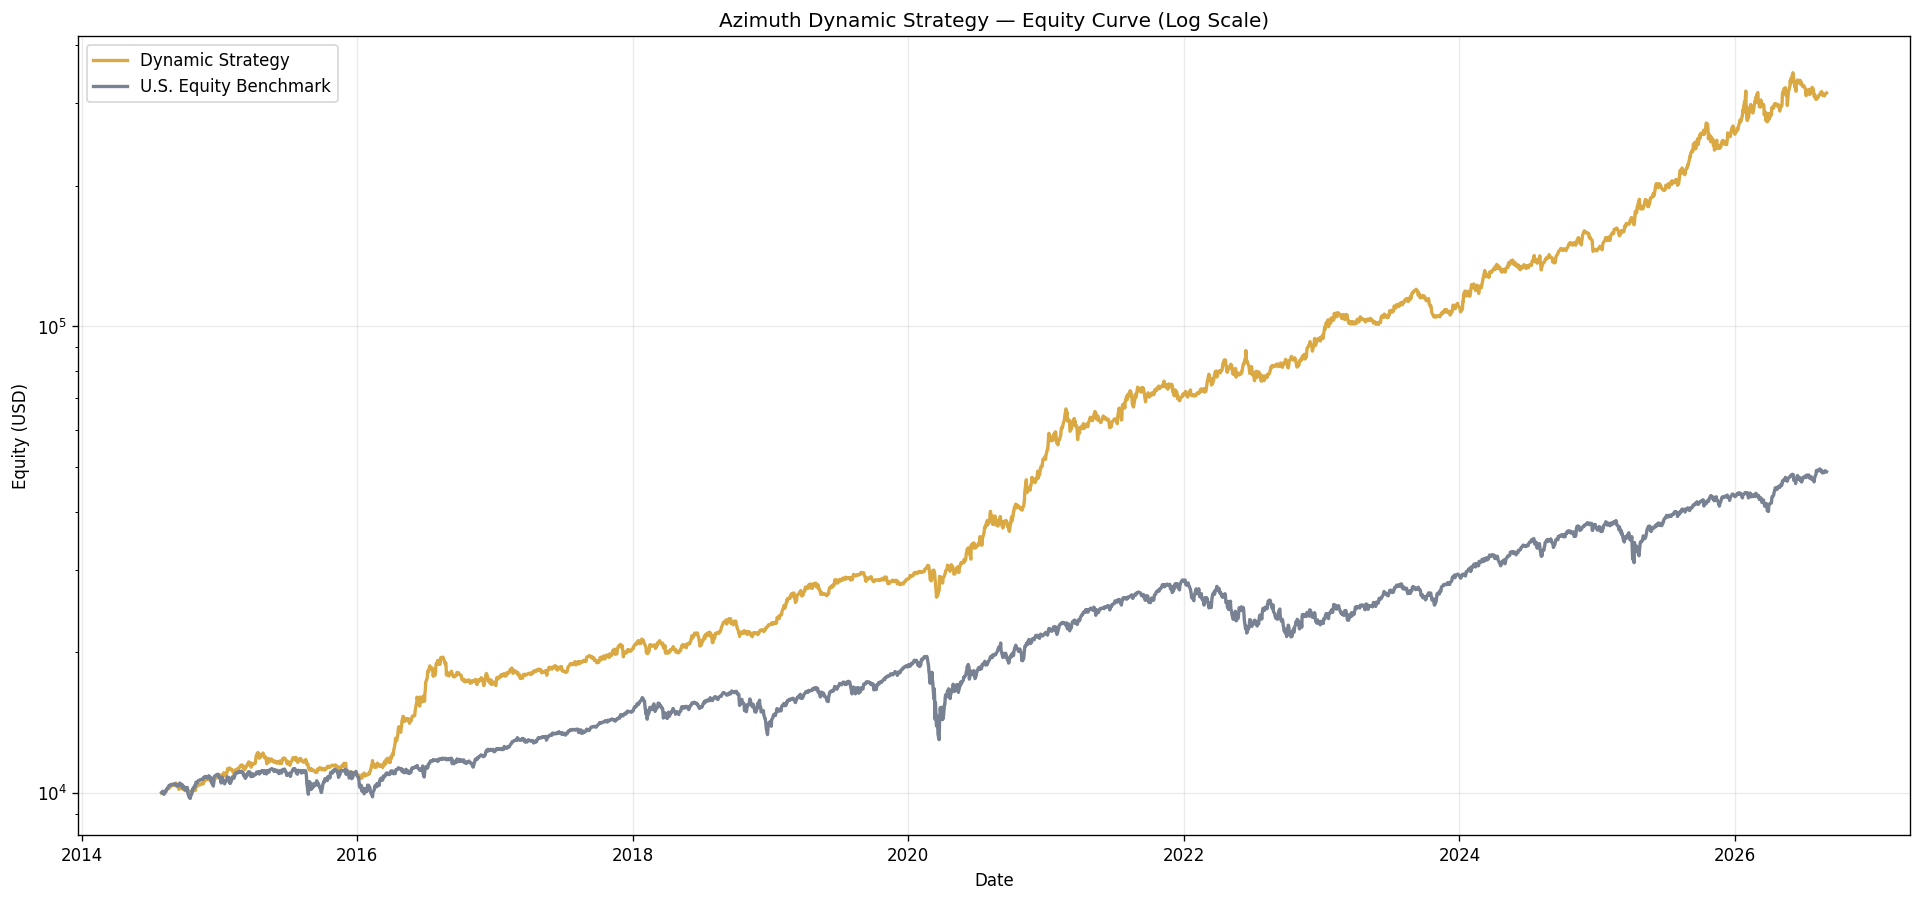
The strategy is compared with the same broad U.S. Equity Benchmark used in the Tactical Allocation materials. The benchmark is shown for context only; Dynamic is not designed to track it.
Equity Curve
Data & Methodology
Portfolio structure: the strategy is a fully funded, long-only adaptive allocation process designed to balance participation and risk through changing market conditions.
Public disclosure: performance, risk characteristics and validation evidence are public. Production portfolio construction and decision logic remain confidential; approved subscribers receive only the implementation information required to follow the current target.
Key Metrics
| Metric | Result | Interpretation |
|---|---|---|
| Net CAGR | 33.19% | Annualized compounded growth over the complete evaluation period. |
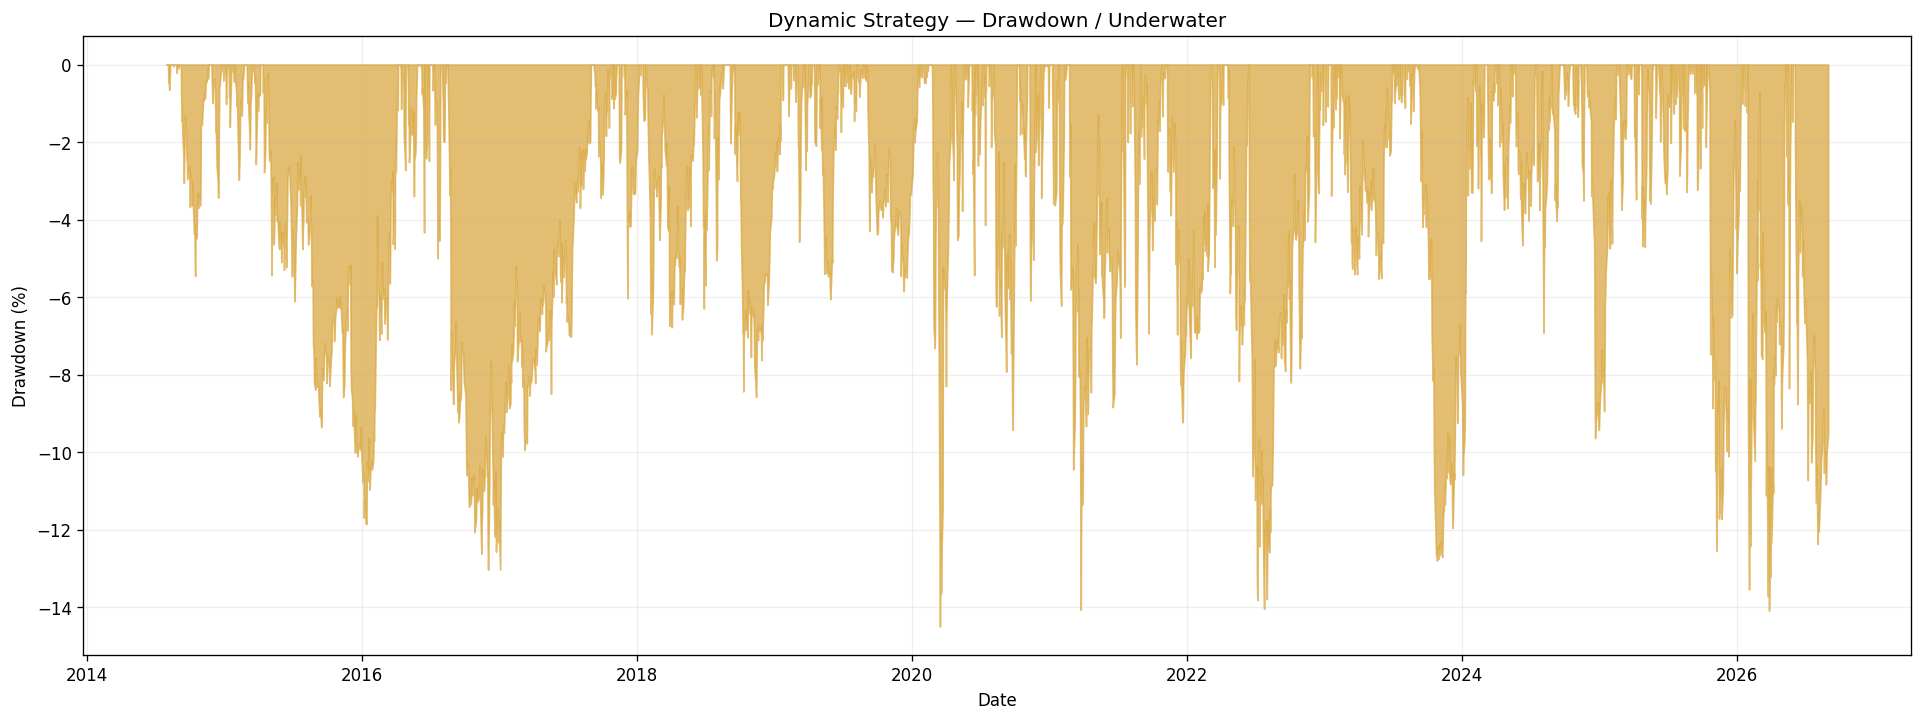
| Maximum drawdown | -14.50% | Worst audited daily-engine peak-to-trough decline. |
| Calmar ratio | 2.29 | CAGR divided by absolute maximum drawdown. |
| Annual volatility | 18.35% | Audited annualized variability. |
| Final multiple | 31.59× | Growth of one unit of starting capital. |
| Worst rolling 1Y | -3.39% | Weakest audited one-year window. |
| Worst rolling 3Y | 13.99% | Weakest audited three-year annualized window. |
| Maximum time below high-water mark | 265 sessions | Longest audited recovery duration. |
Daily Tail Risk Diagnostics
| Diagnostic | Result | Method |
|---|---|---|
| One-day VaR 95% | -1.78% | Parametric normal approximation using audited annual volatility. |
| One-day expected shortfall 95% | -2.26% | Parametric normal approximation; diagnostic only. |
| One-day VaR 99% | -2.57% | Parametric normal approximation using audited annual volatility. |
| One-day expected shortfall 99% | -2.96% | Parametric normal approximation; diagnostic only. |
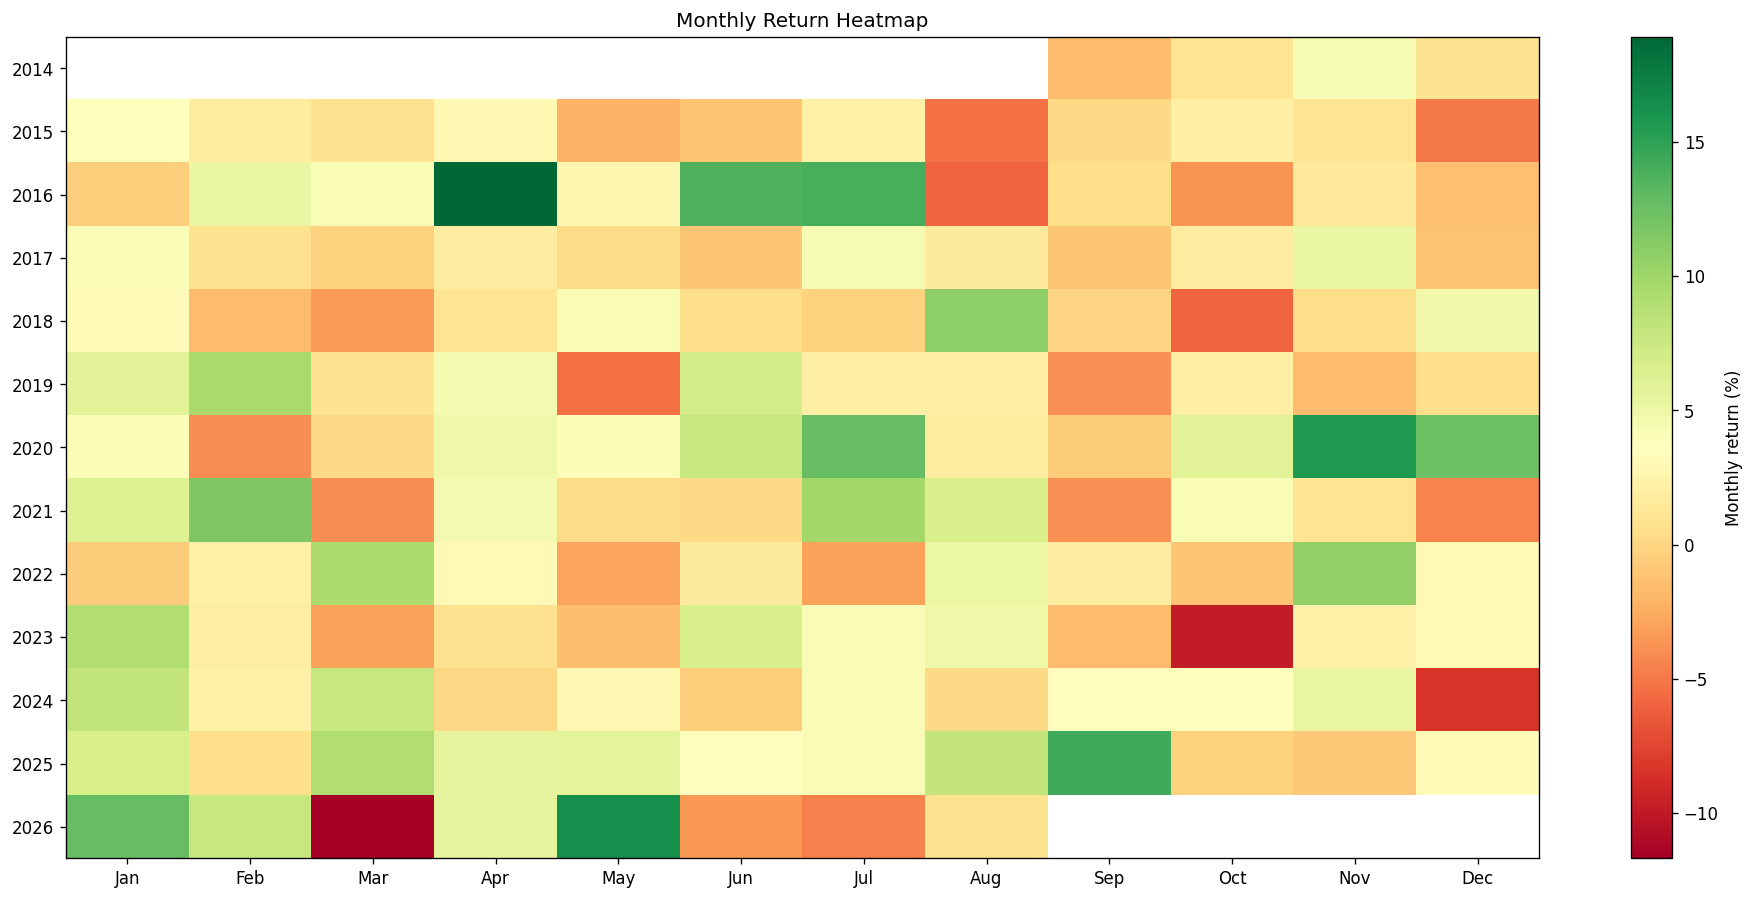
| Negative monthly observations | 28.47% | Frequency in the public monthly observation curve. |
Historical Drawdown & Recovery
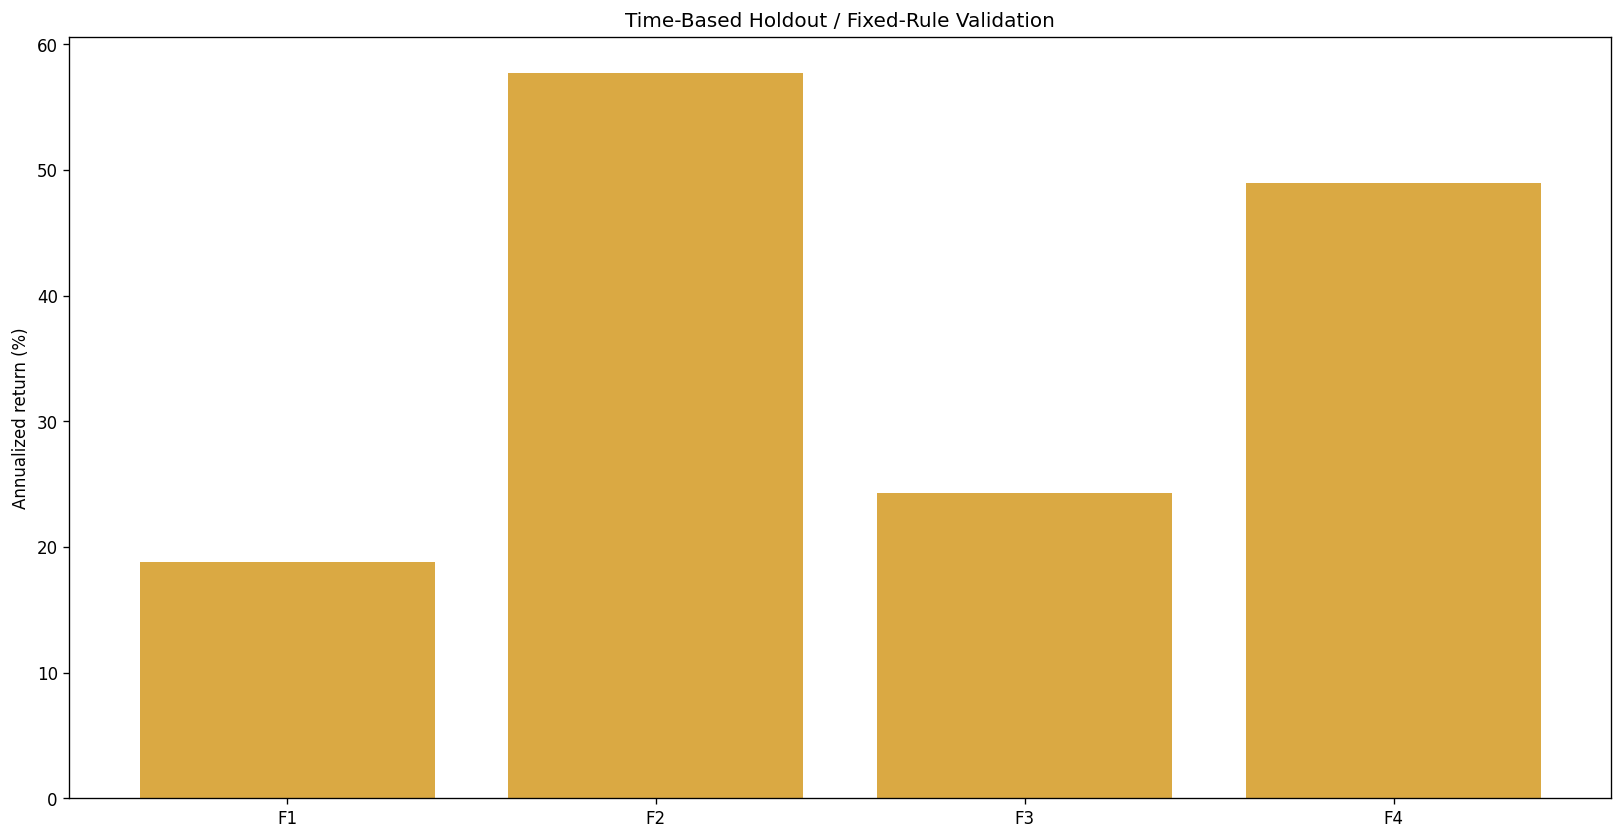
Time-Based Holdout / Out-of-Sample
| Fold | OOS period | Frozen CAGR | Frozen MDD | Frozen Calmar |
|---|---|---|---|---|
| F1 | 2018-01-01 – 2019-12-31 | 18.82% | -8.57% | 2.20 |
| F2 | 2020-01-01 – 2021-12-31 | 57.71% | -14.50% | 3.98 |
| F3 | 2022-01-01 – 2023-12-31 | 24.27% | -14.04% | 1.73 |
| F4 | 2024-01-01 – 2026-08-31 | 48.94% | -14.09% | 3.47 |
Rolling Stability
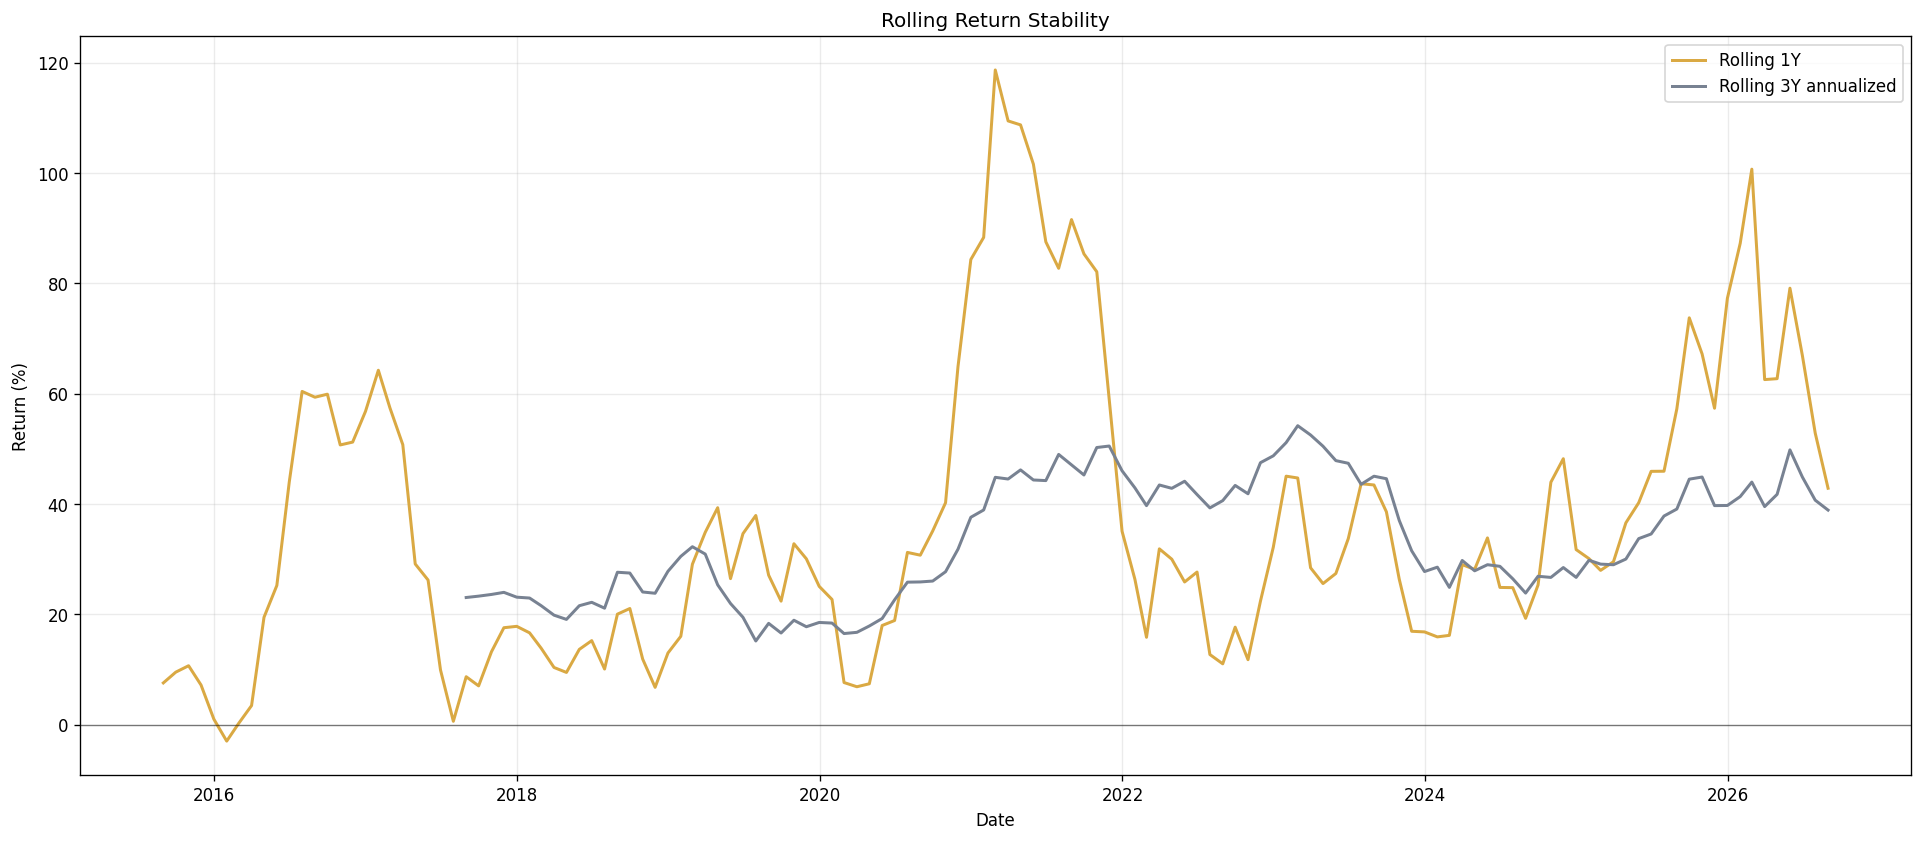
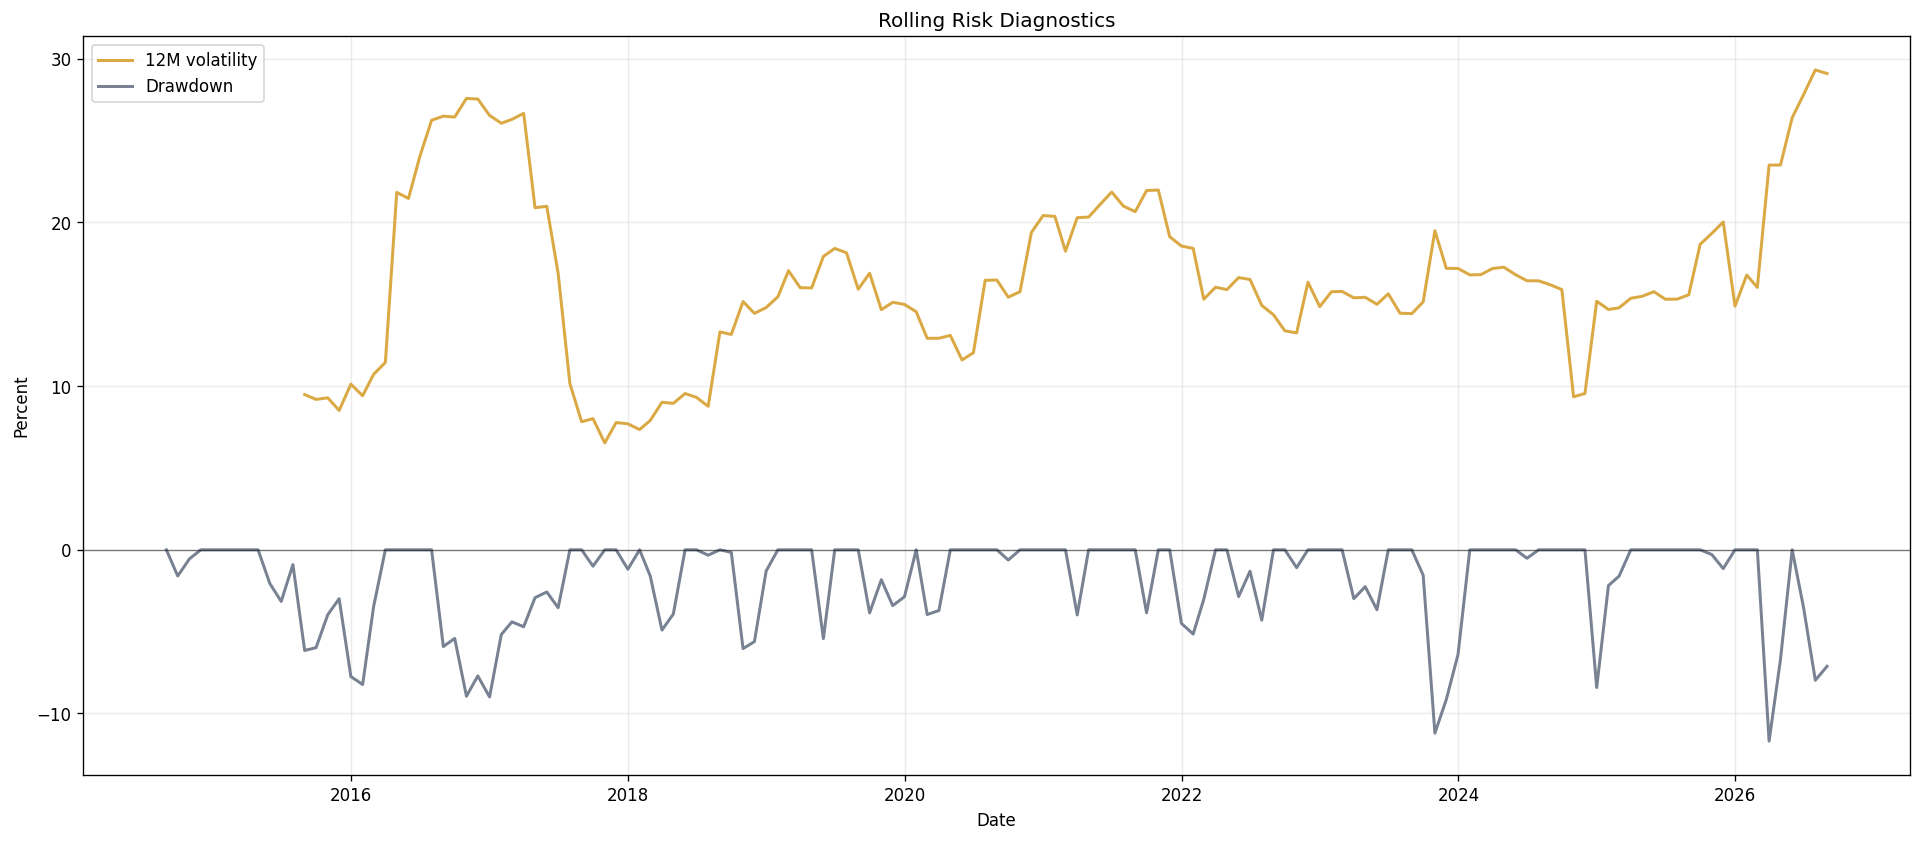
Month-end rolling-window summary
| Window / diagnostic | Observations | Minimum | 10th percentile | Median | Positive |
|---|---|---|---|---|---|
| Rolling 1Y return | 133 | -2.96% | 9.50% | 29.15% | 99.25% |
| Rolling 2Y annualized return | 121 | 5.27% | 18.92% | 30.64% | 100.00% |
| Rolling 3Y annualized return | 109 | 15.19% | 19.24% | 30.95% | 100.00% |
| Rolling 12M volatility | 133 | 6.53% | 9.32% | 15.90% | — |
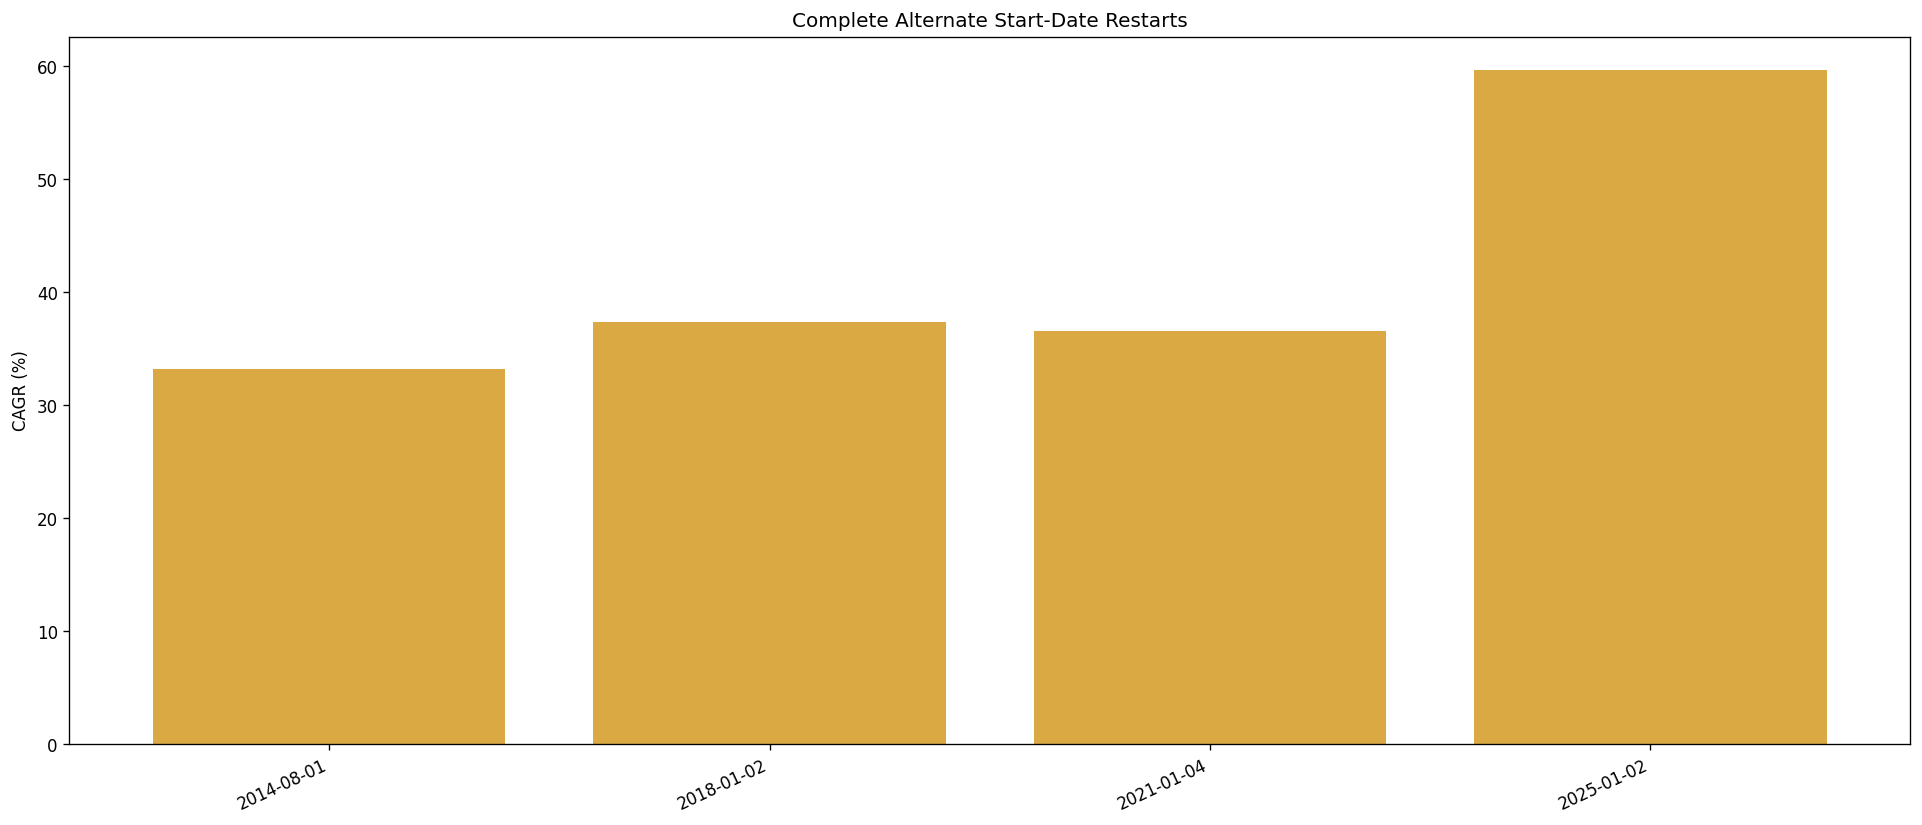
Alternate Start-Date Validation
| Diagnostic | Result |
|---|---|
| Complete restart dates | 4 |
| Positive CAGR rate | 100.00% |
| Minimum CAGR | 33.19% |
| Median CAGR | 37.00% |
| Worst maximum drawdown | -14.50% |
| Minimum available 3Y annualized return | 13.99% |
Methodology & Investment Discipline
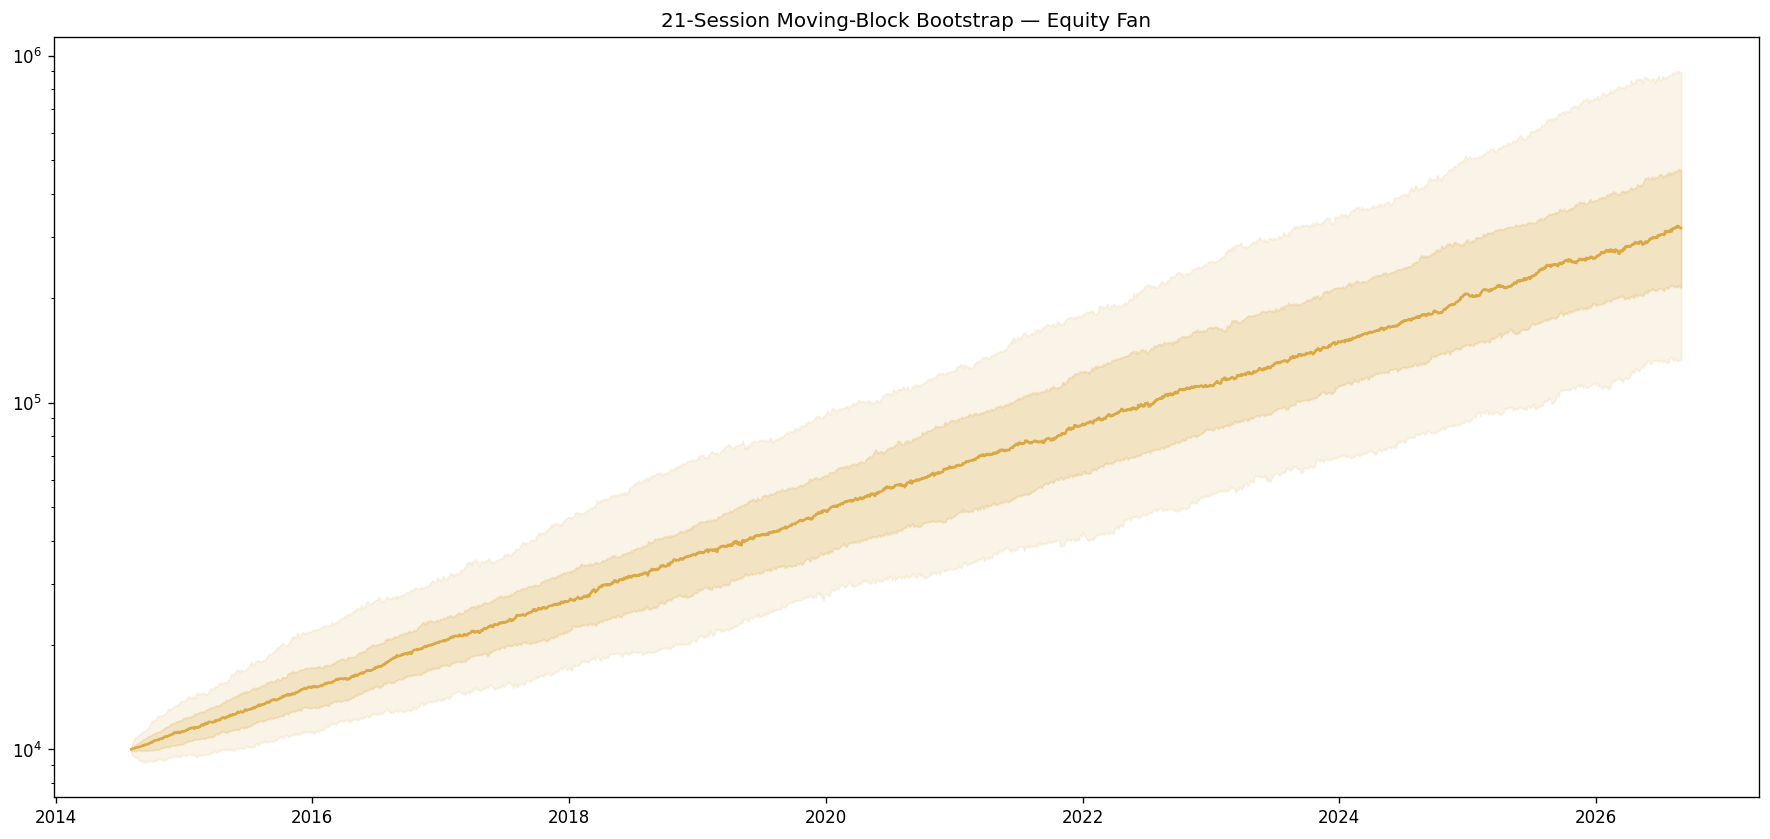
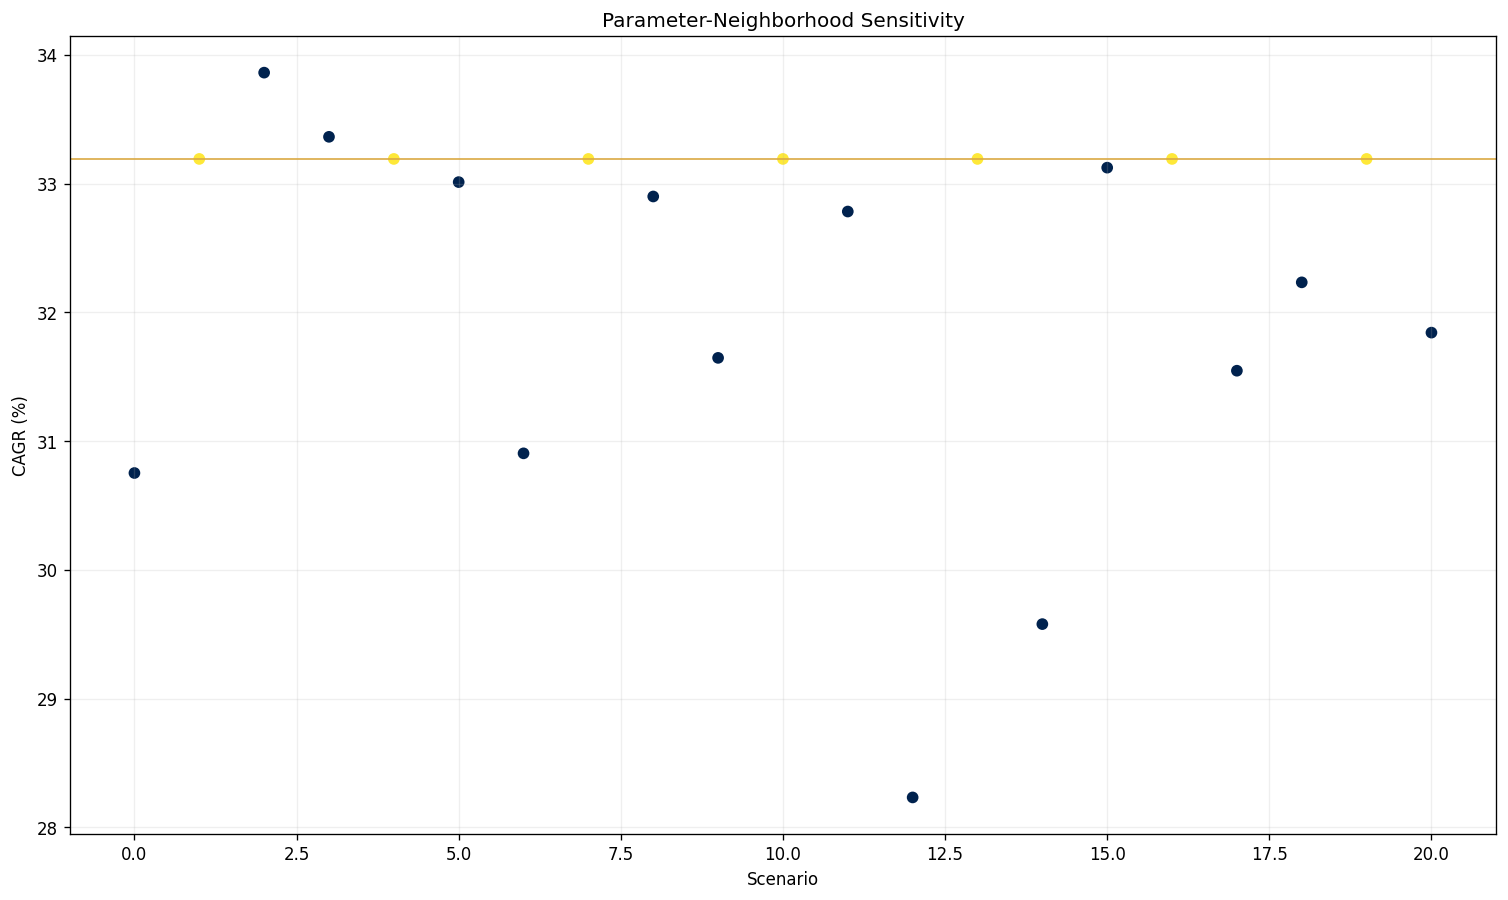
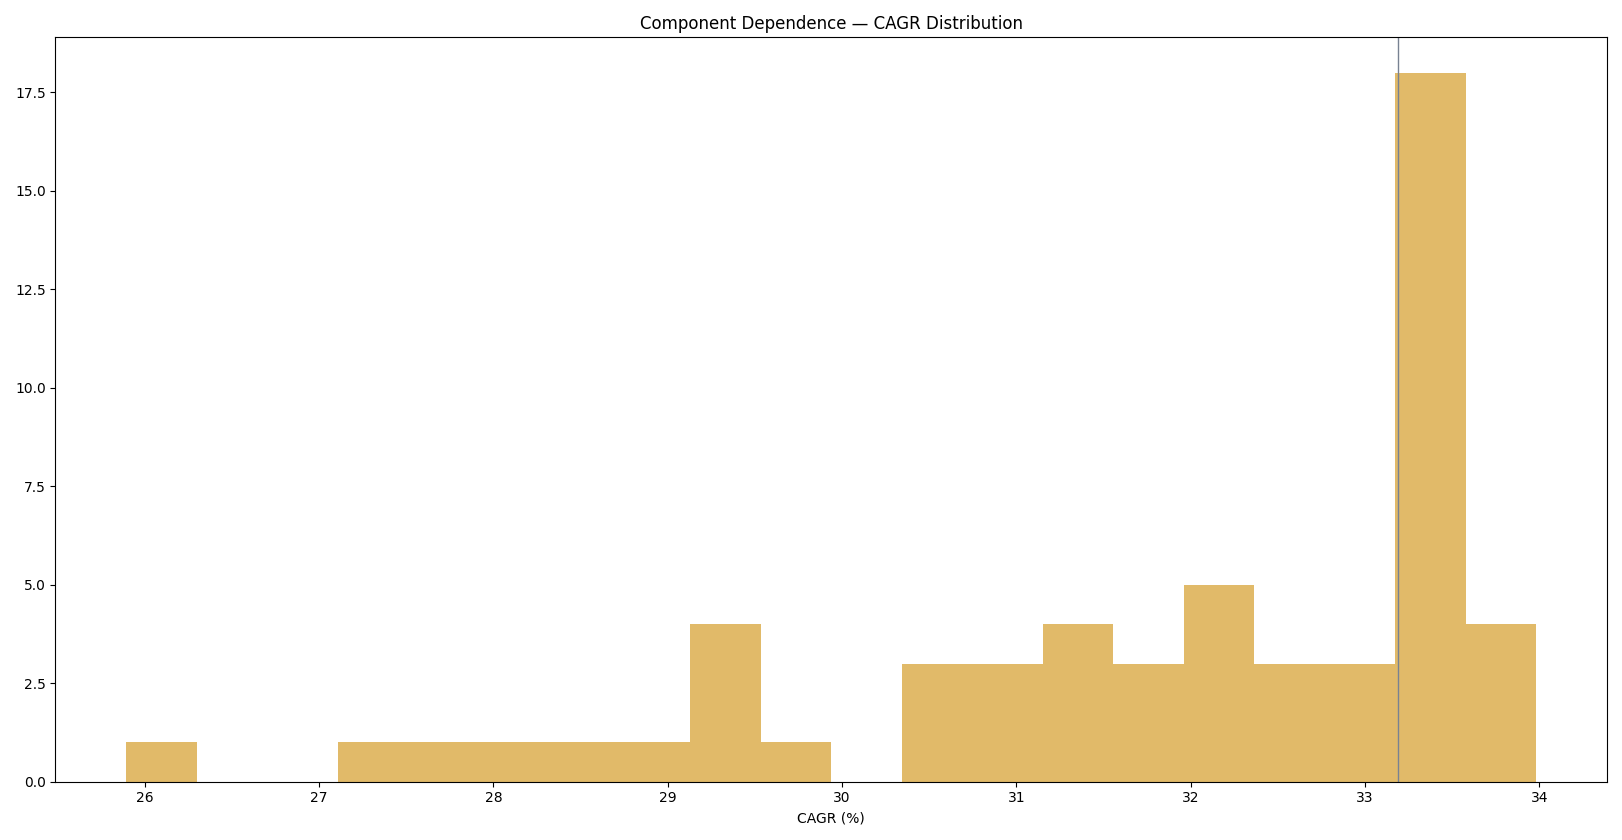
The model was evaluated through full-period metrics, nearby-configuration tests, alternate starts, walk-forward out-of-sample windows, implementation stress, anonymized component perturbations, dependence tests and 2,000-path block-bootstrap simulations.
Fees & Implementation Friction
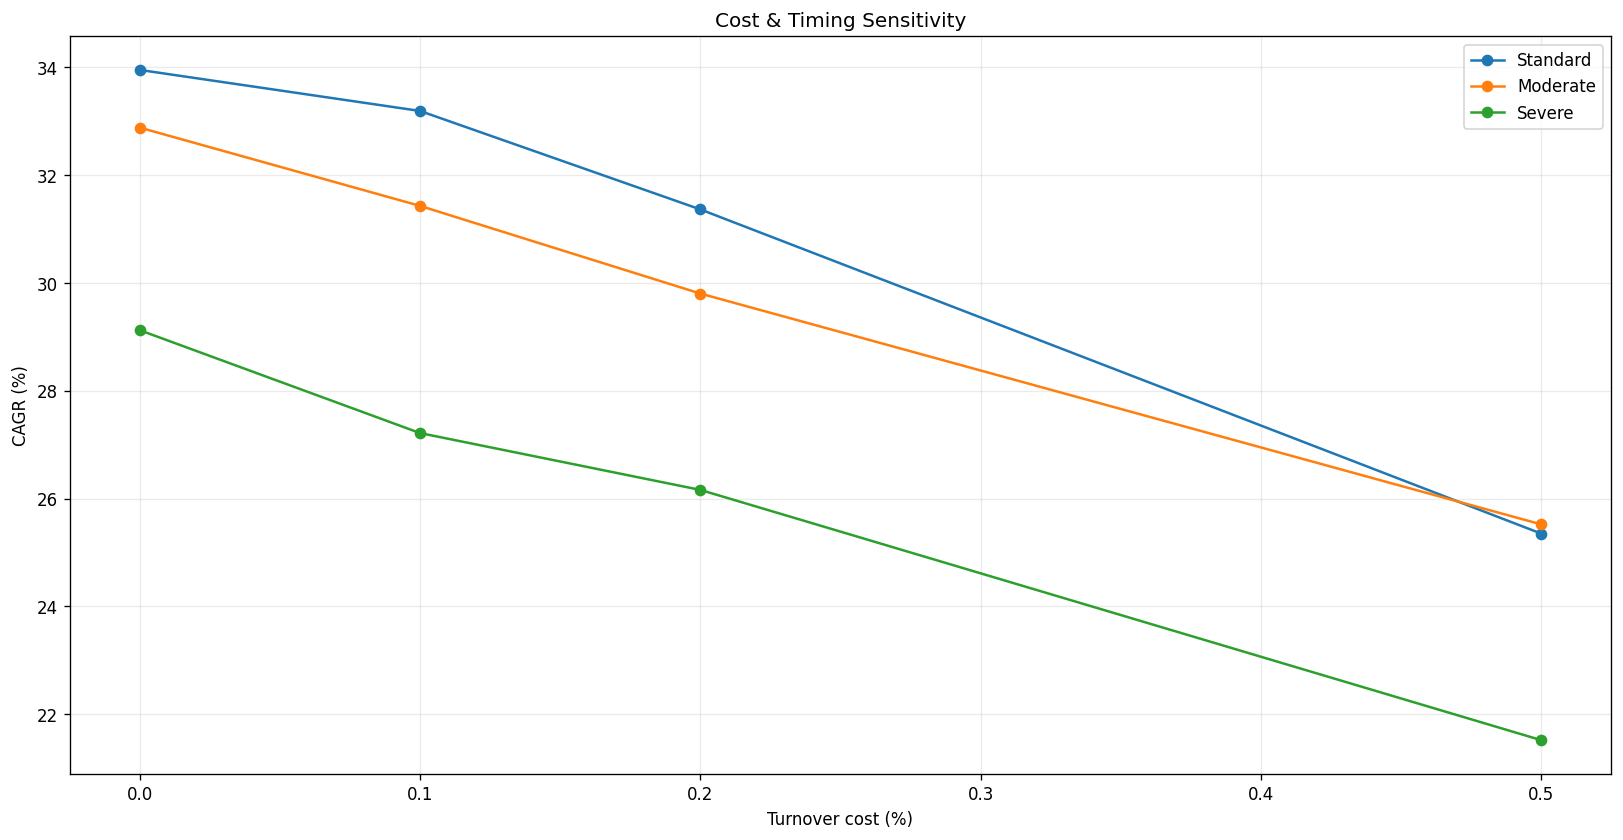
| Scenario | Modeled turnover cost | CAGR | MDD | Calmar | Final multiple |
|---|---|---|---|---|---|
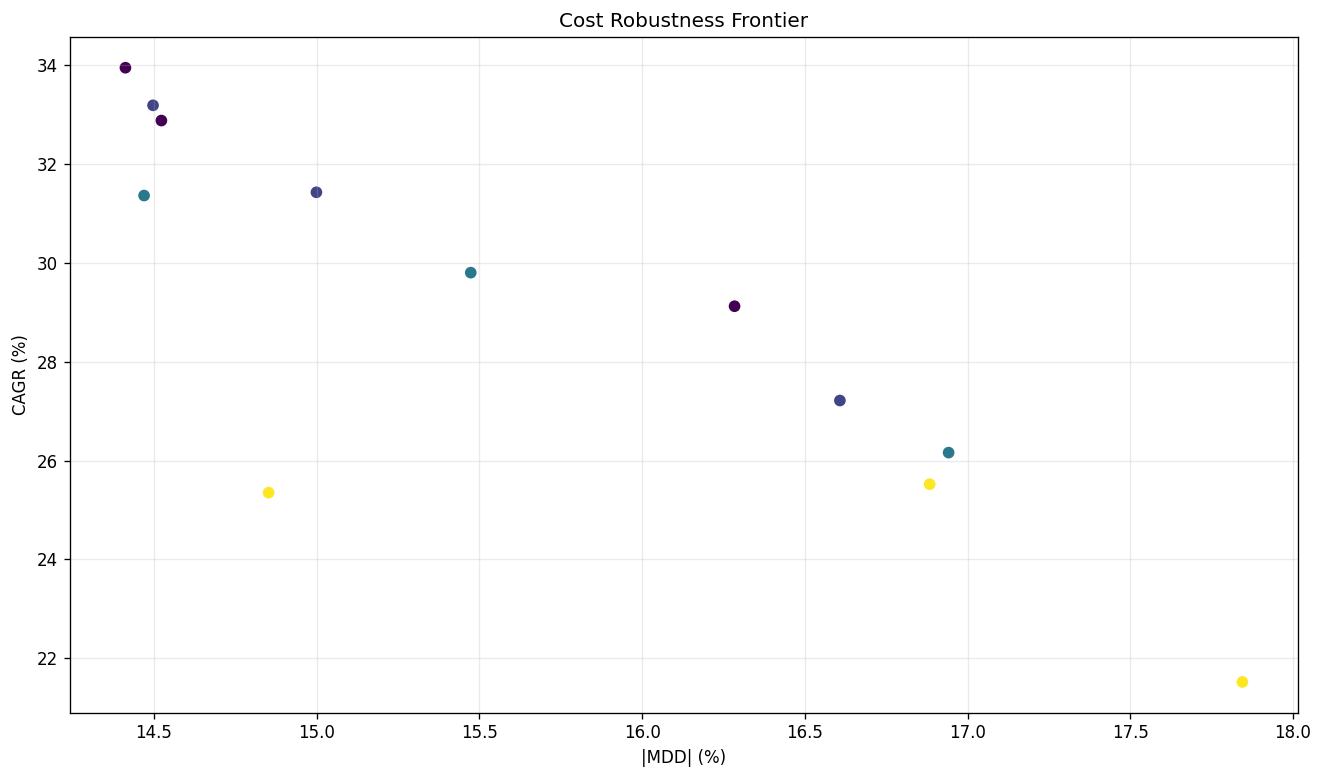
| Standard timing · 0.10% turnover cost | 0.10% | 33.19% | -14.50% | 2.29 | 31.59× |
| Moderate timing stress · 0.20% turnover cost | 0.20% | 29.80% | -15.47% | 1.93 | 23.16× |
| Severe timing stress · 0.50% turnover cost | 0.50% | 21.52% | -17.84% | 1.21 | 10.46× |
Implementation Scenarios
Cost Robustness Frontier
Cost Sensitivity
| Scenario | Modeled turnover cost | CAGR | MDD | Calmar | Final multiple |
|---|---|---|---|---|---|
| Standard timing · 0.10% turnover cost | 0.10% | 33.19% | -14.50% | 2.29 | 31.59× |
| Moderate timing stress · 0.20% turnover cost | 0.20% | 29.80% | -15.47% | 1.93 | 23.16× |
| Severe timing stress · 0.50% turnover cost | 0.50% | 21.52% | -17.84% | 1.21 | 10.46× |
Execution & Structural Robustness
| Base-cost timing case | CAGR | MDD | Calmar | Worst 1Y |
|---|---|---|---|---|
| Standard timing · 0.10% turnover cost | 33.19% | -14.50% | 2.29 | -3.39% |
| Moderate timing stress · 0.10% turnover cost | 31.43% | -15.00% | 2.10 | -7.28% |
| Severe timing stress · 0.10% turnover cost | 27.22% | -16.61% | 1.64 | -8.67% |
Probability of Severe Impairment & Recovery
| Diagnostic | Result | Interpretation |
|---|---|---|
| Historical maximum drawdown | -14.50% | Worst audited daily-engine decline. |
| Maximum days below high-water mark | 265 | Longest audited recovery interval. |
| Monte Carlo probability of positive CAGR | 100.00% | Across 2,000 paths in the 21-session block study. |
| Monte Carlo paths with MDD worse than −25% | 13.90% | Historical MDD understates the range that should be budgeted prudently. |
| Prudent drawdown planning range | 25%–35% | Risk-budgeting range indicated by the tail simulations, not a forecast or limit. |
Synthetic Stress
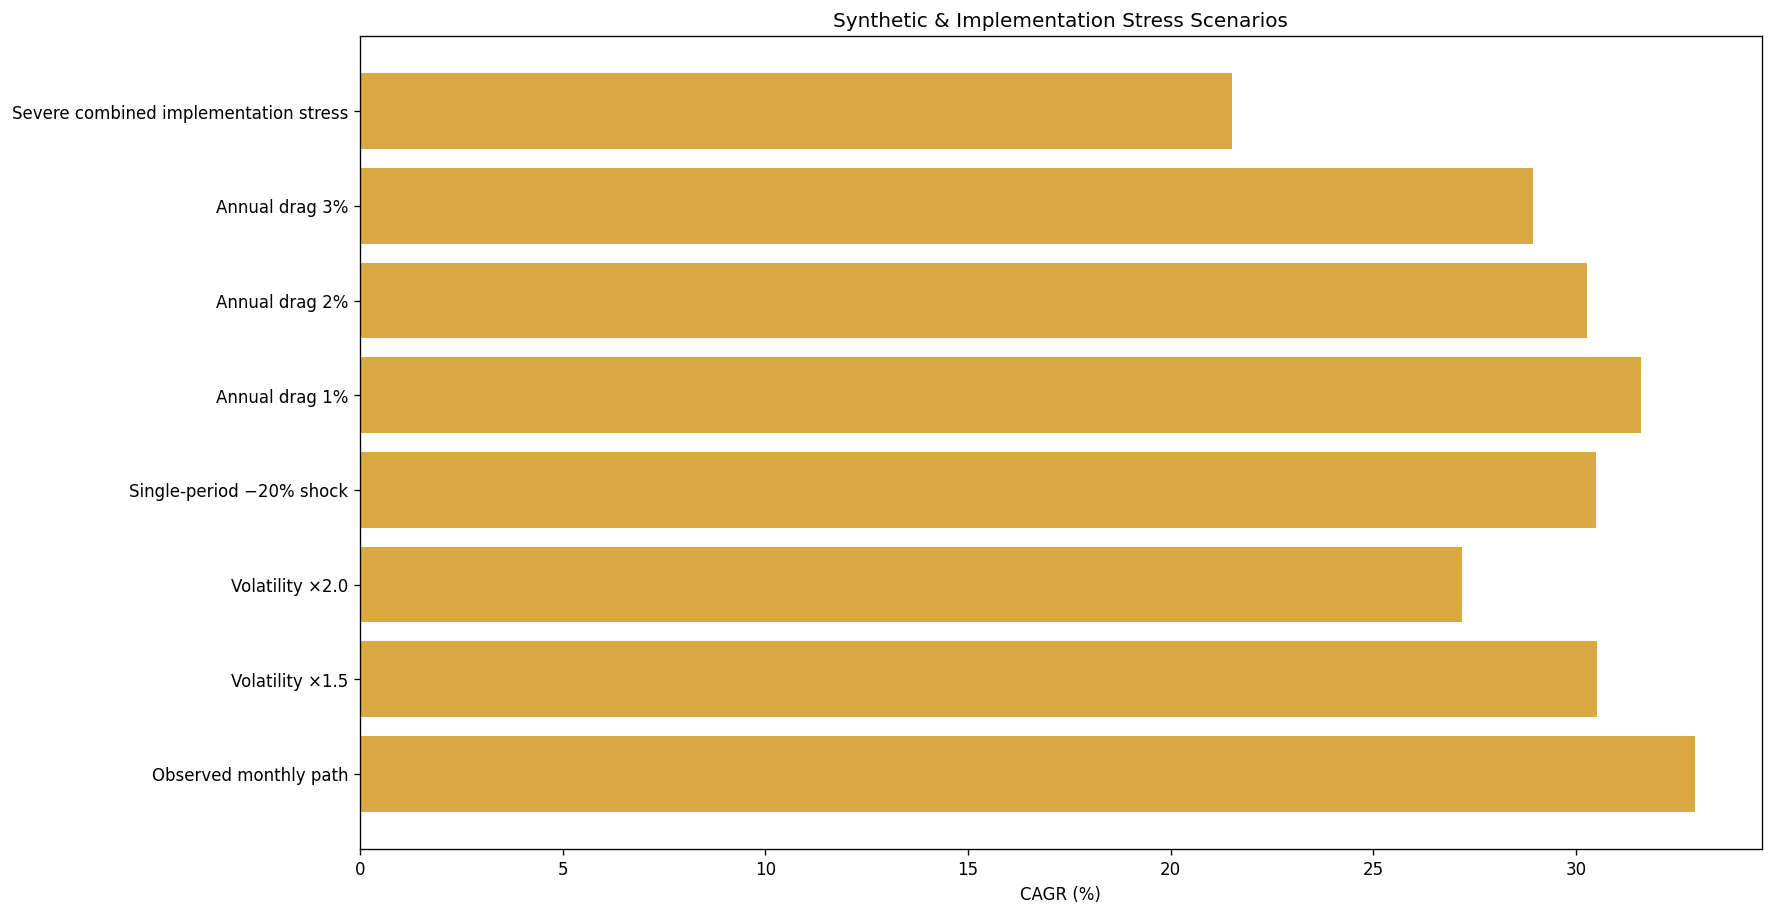
| Scenario | CAGR | MDD | Calmar |
|---|---|---|---|
| Observed monthly path | 32.93% | -11.69% | 2.82 |
| Volatility ×1.5 | 30.51% | -21.95% | 1.39 |
| Volatility ×2.0 | 27.19% | -36.02% | 0.75 |
| Single-period −20% shock | 30.48% | -29.35% | 1.04 |
| Annual drag 1% | 31.60% | -11.76% | 2.69 |
| Annual drag 2% | 30.27% | -11.84% | 2.56 |
| Annual drag 3% | 28.94% | -11.91% | 2.43 |
| Severe combined implementation stress | 21.52% | -17.84% | 1.21 |
Stress Comparison
Robustness & Risk
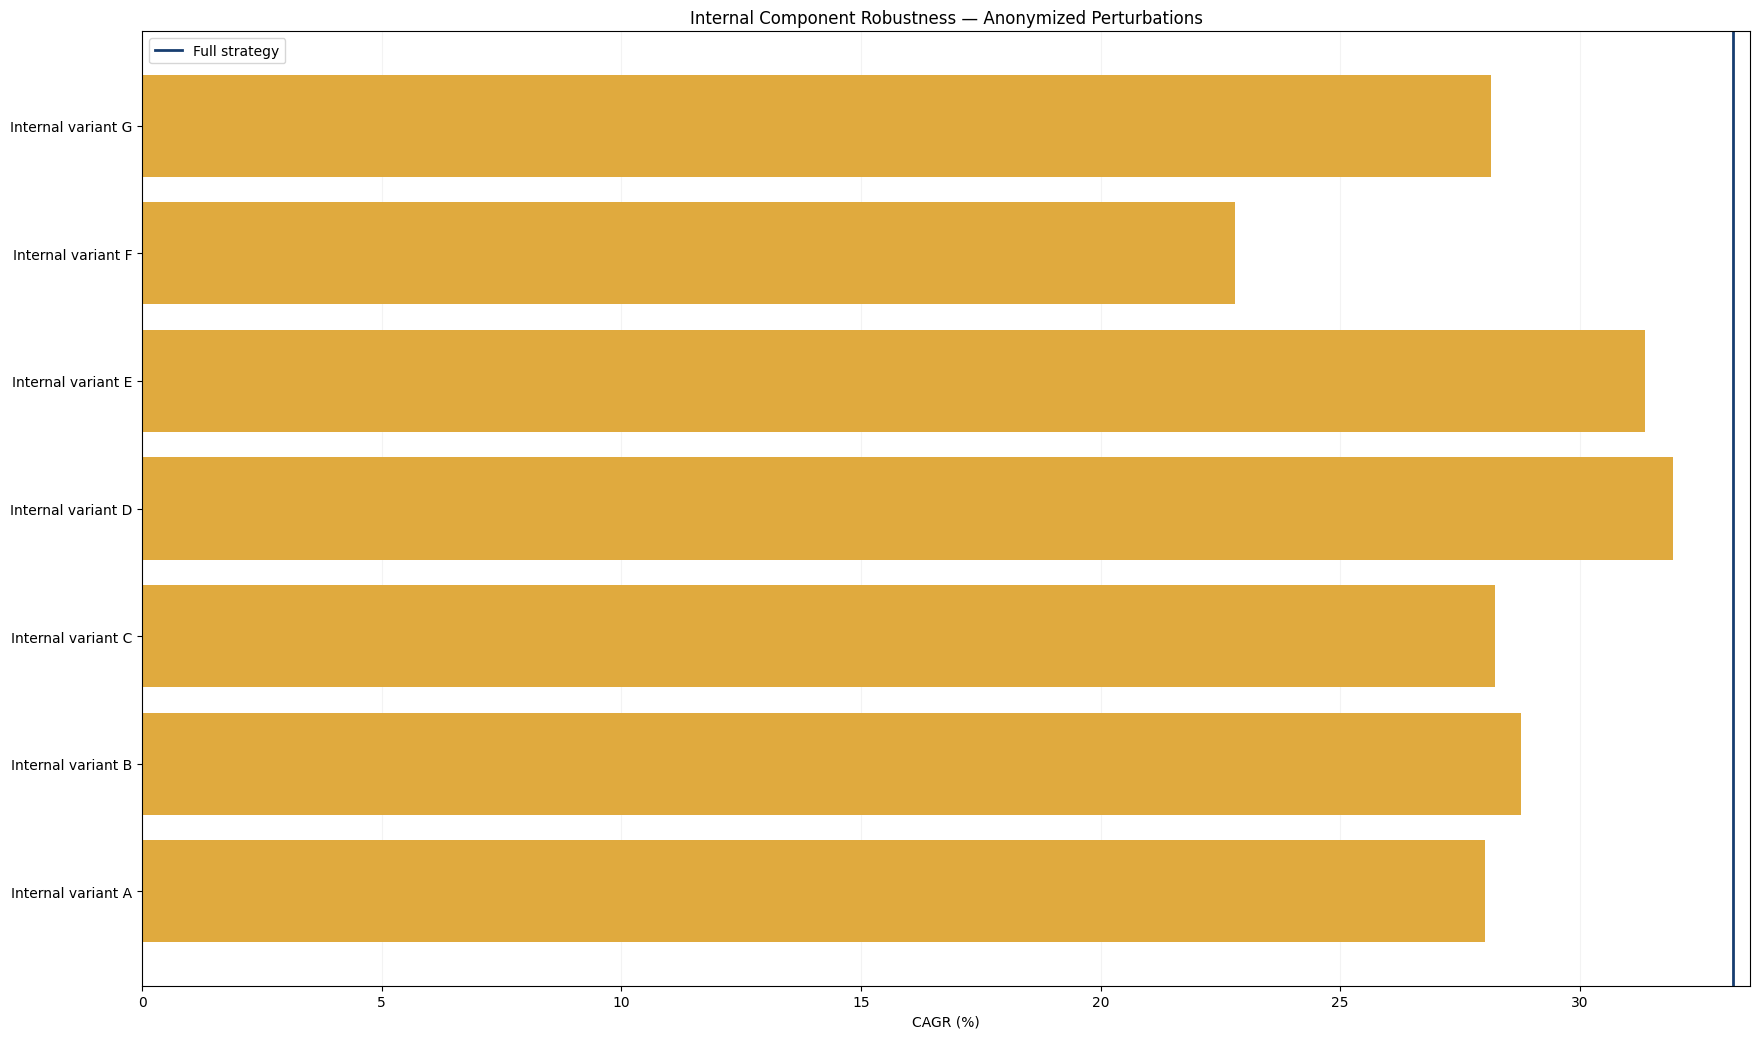
| Anonymized internal perturbation | CAGR | MDD | Calmar |
|---|---|---|---|
| Internal variant A | 28.03% | -16.61% | 1.69 |
| Internal variant B | 28.77% | -20.38% | 1.41 |
| Internal variant C | 28.22% | -21.31% | 1.32 |
| Internal variant D | 31.95% | -17.00% | 1.88 |
| Internal variant E | 31.35% | -17.20% | 1.82 |
| Internal variant F | 22.81% | -14.50% | 1.57 |
| Internal variant G | 28.14% | -19.67% | 1.43 |
Internal Component Robustness
Diversification & Dependence Testing
Monte Carlo
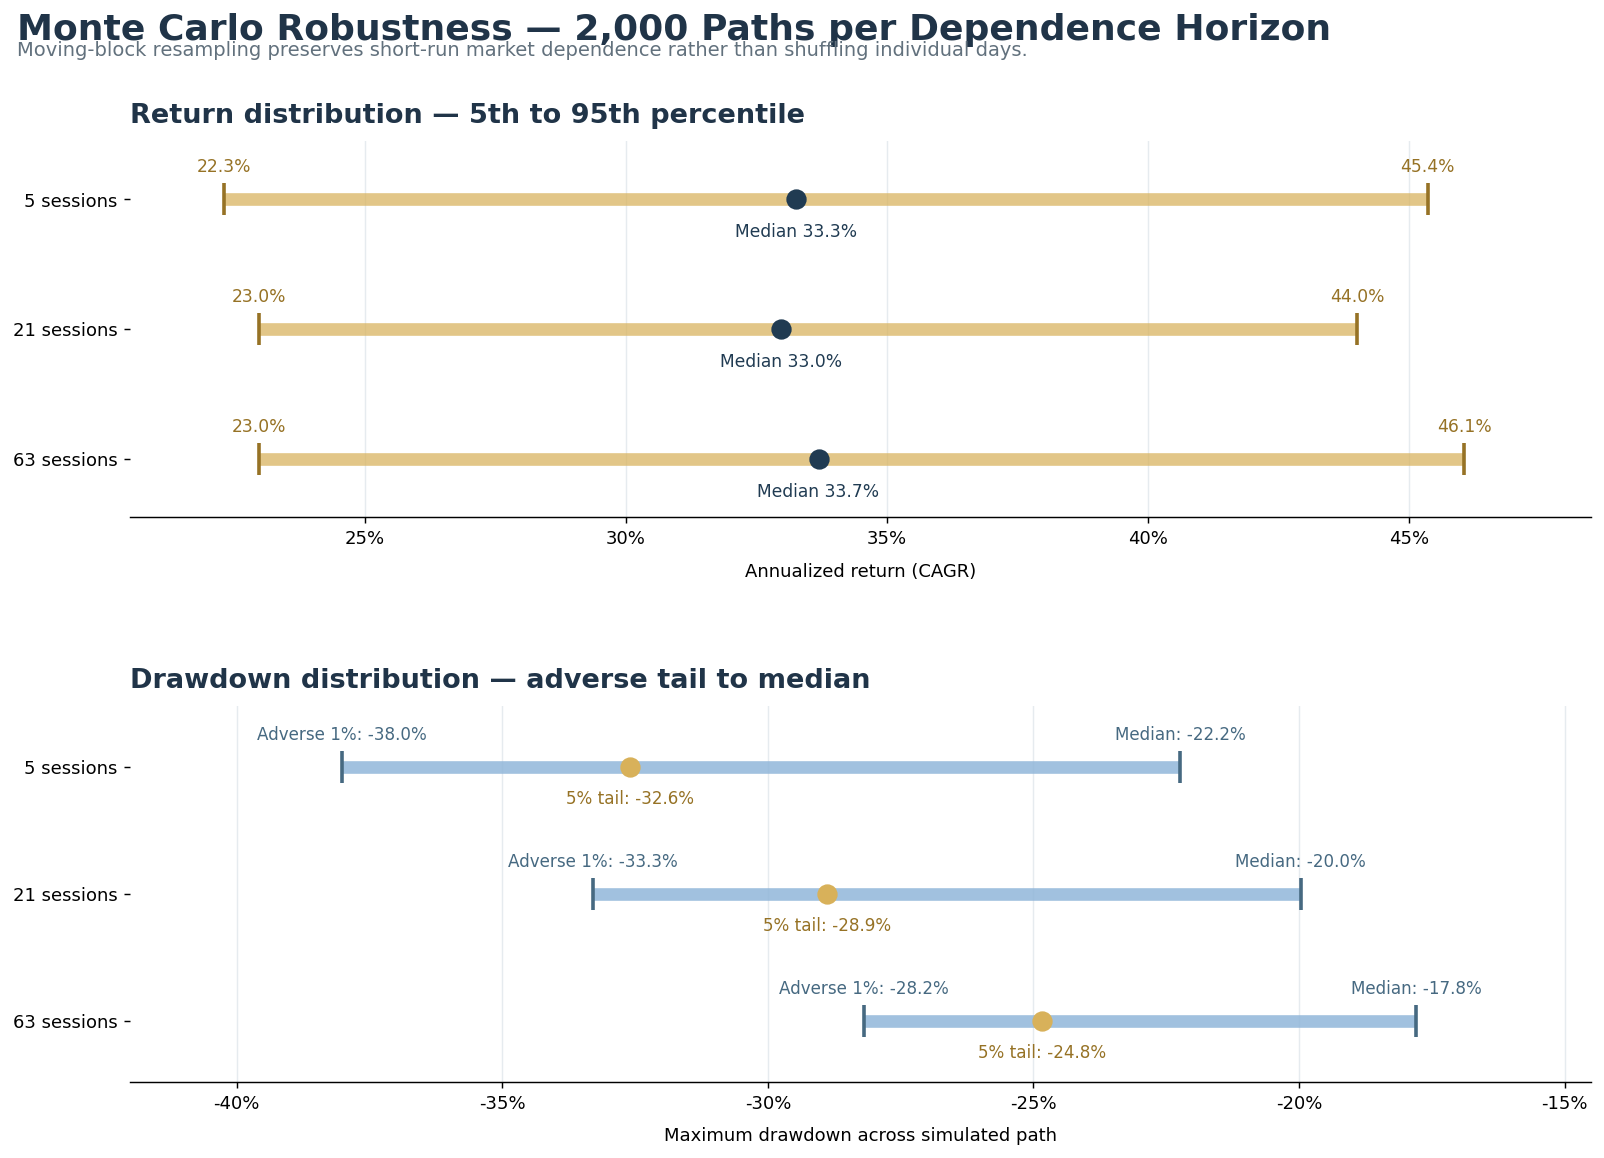
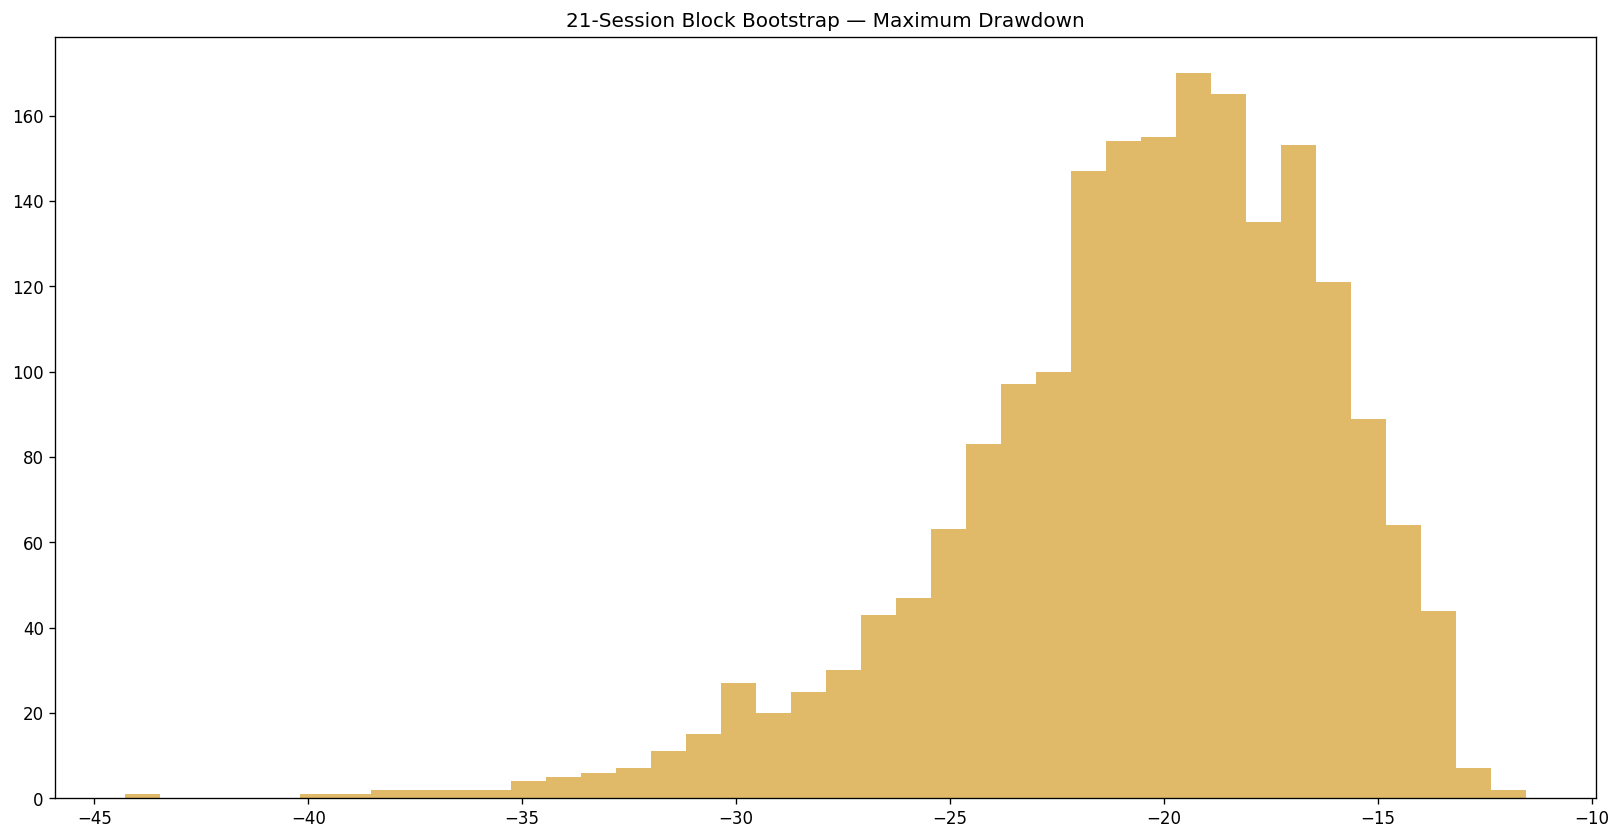
| Block length | CAGR p5 | CAGR median | CAGR p95 | MDD p1 | MDD p5 | MDD median | P(MDD worse than −25%) |
|---|---|---|---|---|---|---|---|
| 5 sessions | 22.29% | 33.26% | 45.36% | -38.02% | -32.59% | -22.24% | 30.20% |
| 21 sessions | 22.96% | 32.98% | 44.01% | -33.29% | -28.88% | -19.97% | 13.90% |
| 63 sessions | 22.96% | 33.69% | 46.06% | -28.19% | -24.84% | -17.80% | 4.60% |
Historical Environment Review
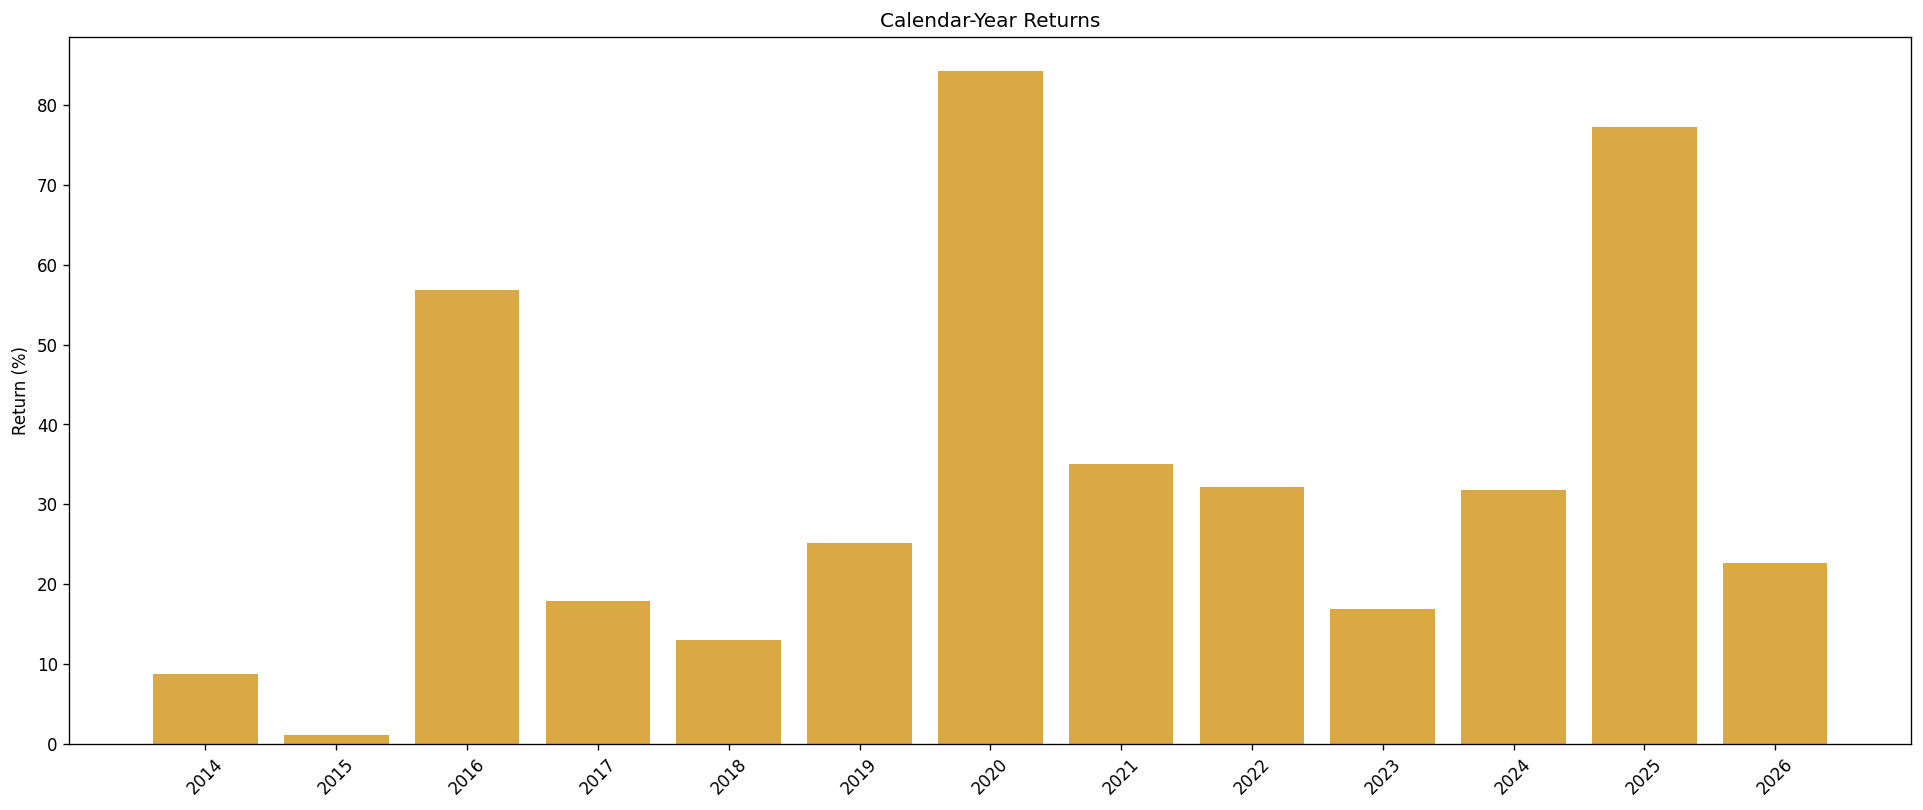
| Historical environment | Calendar year | Return |
|---|---|---|
| Weakest calendar year | 2015 | 1.02% |
| Second-weakest calendar year | 2014 | 8.67% |
| Strongest calendar year | 2020 | 84.34% |
| Second-strongest calendar year | 2025 | 77.31% |
Investor Fit
- Long-horizon investors seeking a systematic adaptive portfolio process.
- Investors who value explicit risk management and disciplined implementation.
- Investors able to tolerate material drawdowns and follow manual allocation alerts.
- Fully funded brokerage accounts that can hold all required instruments.
- Guaranteed capital or guaranteed returns.
- Investors unable to tolerate losses or recovery periods.
- Leverage, short selling or very short holding horizons.
- Generic copy trading or public disclosure of proprietary rules.
Strategy Profile
| Dimension | Profile |
|---|---|
| Primary objective | Adaptive long-term capital growth through a proprietary systematic risk-management framework. |
| Portfolio form | Fully funded, long-only, multi-instrument allocation. |
| Decision structure | Proprietary adaptive allocation framework; internal rule structure remains confidential. |
| Signal delivery | Private manual target-allocation alerts. |
| Copy trading | Not offered. |
| Expected investor behavior | Follow the process through negative periods without discretionary overrides. |
Capacity & Implementation Notes
The strategy is implemented through liquid exchange-traded instruments, but practical capacity depends on account size, local access, lot size, spreads, distributions, taxes and execution quality. Subscribers must use an eligible broker and maintain enough liquidity to implement the consolidated target without leverage.
Because follower accounts differ, manual implementation is the supported path. Exact instruments and target weights are delivered privately.
Review Protocol
The strategy should be reviewed by reproducing the frozen baseline, auditing data quality, testing parameter neighborhoods, checking alternate starts and out-of-sample windows, and confirming that costs and operational constraints remain within the validated range.
Changes should require structural evidence and commercial logic, not merely a higher full-sample CAGR or better recent performance.
Ongoing Review
- Monitor data coverage, instrument availability and implementation quality.
- Compare realized account behavior with the intended consolidated target.
- Repeat sensitivity, out-of-sample and stress studies after material structural changes.
- Preserve a frozen reference version so every proposed modification can be evaluated honestly.
Institutional Notes (Methodology & Interpretations)
Daily versus monthly evidence: headline drawdown, recovery and tail-risk statistics come from the audited daily engine. Some public charts and rolling tables use month-end observation dates for readability and are labeled accordingly.
Out-of-sample interpretation: the four time-based folds use frozen final rules for the reported fixed results. They reduce, but do not eliminate, selection and model risk.
Monte Carlo interpretation: bootstrap percentiles describe resampled historical dependence. They are not confidence limits for future returns and do not model all structural breaks.
Risk budgeting: the historical -14.50% maximum drawdown should not be used as a loss cap; the simulated tail supports planning for materially larger declines.
Important Notes
Historical simulation: all results are hypothetical and may differ from live investor outcomes because of taxes, spreads, fees, rounding, cash flows, distribution treatment and execution differences.
Risk: historical maximum drawdown is not a future loss limit. Monte Carlo evidence supports budgeting for materially larger drawdowns than those observed historically.
No forecast: past simulated performance does not guarantee future results.